Showing posts with label twitter. Show all posts

Thursday, 2 April 2015

Exercise Analytics Using Raspberry Pi, MySQL and APIs

Many of the posts I've been doing since the end of 2014 have been about using exercise API data and exercise database data to ensure I keep fit and healthy.  Key examples are:


This has taught me a lot about myself, in particular the need to set myself targets and periodically measure myself against these targets.  Back in early January 2015 I sent myself an email with this set of targets in it:


It's one quarter into the year, it's time to see how I'm doing against the targets.  First I needed to calculate a set of targets for the quarter.  I did this as Year / 4 rounded up to the nearest integer.  This makes the targets:


(Fitbit based Steps - St and Sleep - Sl have been "pro-rated" as I only got the device at the end of January).

So taking each exercise type in turn, here's how I got the data to compare with the targets.

Strava Data
This is cycling, swimming and running data logged using my Garmin sports watch and uploaded to Strava.

For this I wrote a Python script to extract information from the Strava API.  Full code at the bottom of this post but here's some highlights.

A obtained all the data with a single URL request to the Strava API:
urllib2.urlopen('https://www.strava.com/api/v3/activities?access_token=' + StravaToken + '&per_page=200&after=' + TheUnixTime).read()

Here the per_page=200 entity reference means give me 200 records (more than enough for my Strava efforts) and after= means give all records after the specified period (which is defined in Unix time).

The resulting JSON defeated all my ham-fisted attempts to parse using simple methods so I ended up using the json Python module.  This made life a lot easier!  So with:

StravaJSON = json.loads(StravaText)to access the JSON structures.

...and the likes of ...

StravaJSON[i]['type'] to access specific fields.

...it was easy enough to loop through the whole set of records, pick out all the swims, runs and cycles, add together the distances and write the results.  The output was:

pi@raspberrypi ~/exercise $ sudo python strava_v1.py
Swim Count: 13. Swim Distance: 15600.0
Bike Count: 28. Bike Distance: 282693.4
Run Count: 12. Run Distance: 68337.6

(All distances in metres)

Jerks Exercises
Previously I blogged on how I used a MySQL database on my raspberry Pi to log "physical jerks" (e.g. press ups and sits ups).  I communicate these using a simple code sent in a tweet.

Getting all the data is as simple as running an SQL query.  Here's what I got:

mysql> SELECT exercise, SUM(count) FROM exercise where tdate >= "2015-01-01" GROUP BY exercise order by sum(count);
+--------------------+------------+
| exercise           | SUM(count) |
+--------------------+------------+
| Pilates            |         13 |
| Yoga               |         13 |
| Leg Weights        |         16 |
| Hundred Ups        |         19 |
| General Stretching |         23 |
| Foam Rolling       |         25 |
| Squatting          |        112 |
| Arm Raises         |        322 |
| Side Raises        |        322 |
| Clap Press Ups     |        328 |
| Bicep Curls        |        342 |
| Shoulder Press     |        367 |
| Tricep Curls       |        374 |
| Sit Ups            |        789 |
| Abdominal Crunches |       1429 |
| Press Ups          |       1501 |
| Calf Raises        |       1839 |
+--------------------+------------+

Easy!

Fitbit Data
For the sleep data from my Fitbit Charge HR I re-used code that I used for my sleep infographic.  This gave me a per day sleep figure that I simply summed to give me the total sleep for the period.

For steps data (and floors climbed data) I simply modified the sleep code to 1)access the activities resource and 2)pull out the steps and floors data.  Full code below.  Key parts were getting activity data from the API using fitbit-python:

fitbit_data = authd_client._COLLECTION_RESOURCE('activities',DateForAPI)

.and extracting steps and floors from the resulting JSON:

#Get the total steps value
TotalSteps = fitbit_data['summary']['steps']

#Get the total floors value
TotalFloors = fitbit_data['summary']['floors']

Again I simply summed the data from the summary file to give me the single figure I needed.

Overall Result
Here's a table with the overall result.  Green means target met or exceeded, red means not met.
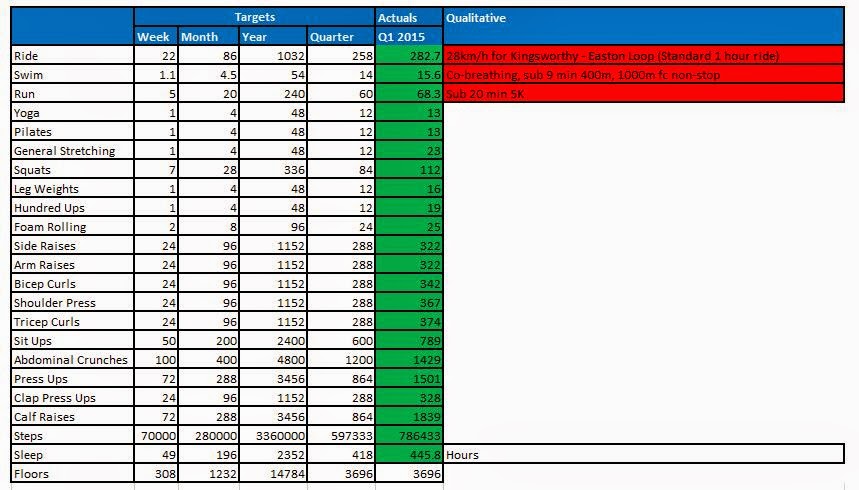


Observations:

  • I nailed all the "counting" targets
  • I missed all the harder qualitative targets (e.g. cycling and running speed).
  • Some counting targets I only just sneaked in (e.g. Yoga and Pilates).  This is generally stuff I don't like doing.
  • Some counting targets I exceeded by a fair amount (e.g. press ups).  These are things I like doing!

So I need to find a way to beat the speed targets I set.  How can technology help me with that??

(I've also added a new target for floors climbed based upon my Q1 daily average).

Strava - Code

import urllib2
import json

#Constants - For Strava
StravaToken = '<Key Here>'


#From http://www.onlineconversion.com/unix_time.htm
TheUnixTime = '1420070400'

#Access the Strava API using a URL
StravaText = urllib2.urlopen('https://www.strava.com/api/v3/activities?access_token=' + StravaToken + '&per_page=200&after=' + TheUnixTime).read()
#print StravaText

#Parse the output to get all the information.  Set up some variables
SwimCount = 0
SwimDistance = 0
RunCount = 0
RunDistance = 0
BikeCount = 0
BikeDistance = 0

#See how many Stravas there are.  Count the word 'name' as there's one per record
RecCount = StravaText.count('name')

#Load the string as a JSON to parse
StravaJSON = json.loads(StravaText)

#Loop through each one
for i in range(0,RecCount):
  #See what type it was and process accordingly
  if (StravaJSON[i]['type'] == 'Swim'):
    SwimCount = SwimCount + 1
    SwimDistance = SwimDistance + StravaJSON[i]['distance']
  elif (StravaJSON[i]['type'] == 'Ride'):
    BikeCount = BikeCount + 1
    BikeDistance = BikeDistance + StravaJSON[i]['distance']
  elif (StravaJSON[i]['type'] == 'Run'):
    RunCount = RunCount + 1
    RunDistance = RunDistance + StravaJSON[i]['distance']

#Print results
print 'Swim Count: ' + str(SwimCount) + '. Swim Distance: ' + str(SwimDistance)
print 'Bike Count: ' + str(BikeCount) + '. Bike Distance: ' + str(BikeDistance)
print 'Run Count: ' + str(RunCount) + '. Run Distance: ' + str(RunDistance)


Fitbit - Code

import fitbit
from datetime import datetime, timedelta
import time

#Constants
CLIENT_KEY = '<Yours Here>'
CLIENT_SECRET = '<Yours Here>'
USER_KEY = '<Yours Here>'
#USER_KEY = '<Yours Here>'
USER_SECRET = '<Yours Here>'

#The first date I used Fitbit
FirstFitbitDate = '2015-01-27'

#Determine how many days to process for.  First day I ever logged was 2015-01-27
def CountTheDays():
  #See how many days there's been between today and my first Fitbit date.
  now = datetime.now()                                         #Todays date
  FirstDate = datetime.strptime(FirstFitbitDate,"%Y-%m-%d")    #First Fitbit date as a Python date object

  #Calculate difference between the two and return it
  return abs((now - FirstDate).days)

#Produce a date in yyyy-mm-dd format that is n days before today's date (where n is a passed parameter)
def ComputeADate(DaysDiff):
  #Get today's date
  now = datetime.now()

  #Compute the difference betwen now and the day difference paremeter passed
  DateResult = now - timedelta(days=DaysDiff)
  return DateResult.strftime("%Y-%m-%d")

#Get a client
authd_client = fitbit.Fitbit(CLIENT_KEY, CLIENT_SECRET, resource_owner_key=USER_KEY, resource_owner_secret=USER_SECRET)

#Find out how many days to compute for
DayCount = CountTheDays()

#Open a file to write the output - minute by minute and summary
SummaryFileToWrite = '/home/pi/exercise/' + 'summary_' + datetime.now().strftime("%Y-%m-%d") + '.csv'
SummaryFile = open(SummaryFileToWrite,'w')

#Process each one of these days stepping back in the for loop and thus stepping up in time
for i in range(DayCount,-1,-1):
  #Get the date to process
  DateForAPI = ComputeADate(i)

  #Tell the user what is happening
  print 'Processing this date: ' + DateForAPI

  #Get sleep
  fitbit_data = authd_client._COLLECTION_RESOURCE('activities',DateForAPI)

  #Get the total steps value
  TotalSteps = fitbit_data['summary']['steps']

  #Get the total floors value
  TotalFloors = fitbit_data['summary']['floors']

  #Write a log of summary data
  SummaryFile.write(DateForAPI + ',' + str(TotalSteps) + ',' + str(TotalFloors) + ',' '\r\n')

  #Wait a bit (for API rate limit)
  time.sleep(1.1)

#We're now at the end of the loop.  Close the file
SummaryFile.close()


Saturday, 24 January 2015

Raspberry Pi - Python - MySQL - Cron Jobs and Physical Jerks #2

In a previous posting I described how I used Twitter, Python and MySQL to capture and log my exercise habits (what I like to call physical jerks).

What I've learnt about myself over the years is that to keep exercising regularly I need:

  • Gratification, i.e. something to say "well done" when I've done some exercise (a la Strava Kudos).
  • Having some fun data to play with.
  • Nagging, i.e. something to keep telling me to do my exercises. 
  • Targets

I talked about gratification in my last Jerks post.  When I do exercise, I tweet, my Raspberry Pi picks this up and sends me a Twitter DM to say "well done".  Example:


When it comes to fun data, it's a virtuous circle.  I exercise more and get fitter, I get more fun data. I want more fun data, I exercise more and get fitter.  At the time of writing the database looks something like this:

mysql> SELECT exercise, SUM(count) FROM exercise GROUP BY exercise order by sum(count);
+--------------------+------------+
| exercise           | SUM(count) |
+--------------------+------------+
| Yoga               |          7 |
| Pilates            |          7 |
| Leg Weights        |         10 |
| Hundred Ups        |         11 |
| Foam Rolling       |         16 |
| General Stretching |         16 |
| Squatting          |         55 |
| Side Raises        |        169 |
| Arm Raises         |        169 |
| Bicep Curls        |        176 |
| Shoulder Press     |        182 |
| Tricep Curls       |        239 |
| Clap Press Ups     |        263 |
| Sit Ups            |        335 |
| Abdominal Crunches |        578 |
| Press Ups          |        872 |
| Calf Raises        |       1384 |
+--------------------+------------+
17 rows in set (0.13 sec)

When it comes to nagging, this is what I've been working on recently.  I decided to create a Python script that would periodically email with details of:
  • Jerks I've done today
  • Jerks I did yesterday
  • Jerks I've done this week
  • Jerks I've done this month
  • Jerks I've done this year
  • All time Jerks
The SQL for this is pretty basic, (similar to that laid out above but with date parameters).  The first thing I needed to do was be able to look at today's date and calculate some other dates as offsets to it (i.e. date yesterday, date of start of week, date of start of year).  Here's an example for start of week from the GetADate function (full code below):

 elif (DateType == DateFirstDayOfMonth):
      now = datetime.now()
      DayOfMonth =  int(now.strftime("%d"))
      DayDelta = DayOfMonth - 1
      FirstDateOfMonth = now - timedelta(days=DayDelta)
      return FirstDateOfMonth.strftime("%Y-%m-%d")

This uses the "%d" attribute for strftime to return the number associated with the day of month.  e.g. would return 24 for today, the 24th of January.  It then uses the timedelta method (imported from datetime) with an offset of the day number minus 1 (so 23 in my example) to calculate the date of the first day of the month.  This is then returned to be used in the SQL.

The email I create is formed from HTML so there's a function (CreateHTMLTable) that takes an SQL cursor as an attribute and forms a heading plus HTML table.  It does this no matter how many columns or rows in the SQL response.  This results in a HTML segment, albeit with no indentation.

I send the email using methods from the smtplib module.  There's plenty of examples of how to do this on the interweb.  I used this one from Stack Overflow that shows how to create HTML and text emails.  The full code is shown below in the SendEmail function and is pretty self-explanatory.  What I did find is that when I tried to use my Gmail and Outlook.com accounts to send the email, these providers did not "like" me using this method to send.  Gmail blocked it out-right, telling me to lower  my privacy settings to continue (which I didn't).  Outlook.com kept asking me to re-authenticate my account which was a pain.  I ended up using an old, unused email account from my ISP which seems to less restrictions.  (It's re-assuring that Google and Microsoft have implemented these feature).

So a cron job runs the script every hour (from 8am to 10pm at weekends and 6pm to 10pm on weekdays).  The email comes to my smartphone and,  as I'm basically addicted to it, I pick it up pretty quickly.  The first email of the day is often something like this which is a big insulting nag to do something:


...but then I get emails like this which is like "get in, did more today than yesterday":


Then I get a series of interesting summaries like these:


...and these:


Followed by a reminder of the short codes for the TUI:

So that just leaves the targets.  I set these at the start of the year:


...but currently have to manually compare actuals with targets.  Sounds like another Geek Dad project to create a nagging capability that includes targets...

Full code listing:

#V1 - First version with exercise table summary
#V2 - Second version with HTML tables and lookup summary
#V3 - Added more summaries and a def to create tables
#V4 - Finished the summaries and formatting changes

#Sends a summary email of Jerks exercise
from datetime import datetime, timedelta
import smtplib
import MySQLdb

#MIME multipart stuff
from email.mime.multipart import MIMEMultipart
from email.mime.text import MIMEText

#Email Constants
smtpserver = 'SMTP Server Here'
AUTHREQUIRED = 1 # if you need to use SMTP AUTH set to 1
smtpuser = 'SMTP Username Here'  # for SMTP AUTH, set SMTP username here
smtppass = 'SMTP Password Here'  # for SMTP AUTH, set SMTP password here
RECIPIENTS = 'Receiving address Here'
SENDER = 'Sending address Here'

#Database related contents
dbMainTable = "exercise"
dbLookupTable = "lookup"

#Date manipulation related constants
DateToday = 'DateToday'
DateYesterday = 'DateYesterday'
DateFirstDayOfWeek = 'DateFirstDayOfWeek'
DateFirstDayOfMonth = 'DateFirstDayOfMonth'
DateFirstDayOfYear = 'DateFirstDayOfYear'

#Gets a initial timestampt for emails
def GetDateTime():
  #Get the time, format it and return it
  now = datetime.now()
  return str(now.date()) + ' ' + str(now.strftime("%H:%M:%S"))

#Send an email
def SendEmail(TheSubject,TheMessage):
  #Form the message
  #msg = "To:%s\nFrom:%s\nSubject: %s\n\n%s" % (RECIPIENTS, SENDER, TheSubject, TheMessage)

  #Start forming the MIME Multipart message
  msg = MIMEMultipart('alternative')
  msg['Subject'] = TheSubject
  msg['From'] = SENDER
  msg['To'] = RECIPIENTS

  # Record the MIME types of both parts - text/plain and text/html.
  #part1 = MIMEText(text, 'plain')
  part2 = MIMEText(TheMessage, 'html')

  # Attach parts into message container.
  # According to RFC 2046, the last part of a multipart message, in this case
  # the HTML message, is best and preferred.
  #msg.attach(part1)
  msg.attach(part2)

  #print msg

  #Do the stuff to send the message
  server = smtplib.SMTP(smtpserver,587)
  server.ehlo()
  #server.starttls()
  server.ehlo()
  server.login(smtpuser,smtppass)
  server.set_debuglevel(1)
  server.sendmail(SENDER, [RECIPIENTS], msg.as_string())
  server.quit()

#Creates a string with a HTML table and a heading based upon parameters sent
def CreateHTMLTable(InDBResult, InTitle):
  try:
    #Start with the heading
    OutString = '<H2>' + InTitle + '</H2>\r\n'

    #See if there is anything to write
    if (InDBResult.rowcount > 0):
      #Add the table opening tag
      OutString = OutString + '<table border="1">\n\r'

      #Loop through each of the database rows, adding table rows
      for row in InDBResult:
        #New table row
        OutString = OutString + '<tr>\r\n'
        #Add the table elements
        for DBElement in row:
          OutString = OutString + '<td>' + str(DBElement) + '</td>\r\n'

        #Close the table row
        OutString = OutString + '</tr>\r\n'

      #Close the table tag
      OutString = OutString + '</table>\r\n'
      #Return the result
      return OutString
    else:
      OutString = OutString + '<p>No database results for this time period.  Come on Jerk!</p>\r\n'
      return OutString
  except:
    return 'Error creating HTML table.\r\n'

#Returns a date based upon the parameter supplied
def GetADate(DateType):
  #try:
    if (DateType == DateToday):    #Just get and return todays date
      #Get the time, format it and return it
      now = datetime.now()
      return now.strftime("%Y-%m-%d")
    elif (DateType == DateYesterday):
      now = datetime.now()
      TheDateYesterday = now - timedelta(days=1)
      return TheDateYesterday.strftime("%Y-%m-%d")
    elif (DateType == DateFirstDayOfWeek):   #The first day of the current week.  Sunday is 0. Monday is 1 etc.  We want to know how many days from Monday it is
      #Find what day of the week it is
      now = datetime.now()
      DayOfWeek = int(now.strftime("%w"))   #Get the number of the day of the week
      print 'Day of week ->>' + str(DayOfWeek)
      #See what to subtract.  Sunday is a special case
      if (DayOfWeek == 0):
        DayDelta = 6         #Monday was always 6 days ago on a Sunday!
      else:
        DayDelta = DayOfWeek - 1
      print 'Day delta ->>' + str(DayDelta)
      DateOfMonday = now - timedelta(days=DayDelta)
      print 'Monday was ->>' + str(DateOfMonday)
      return DateOfMonday.strftime("%Y-%m-%d")
    elif (DateType == DateFirstDayOfMonth):
      now = datetime.now()
      DayOfMonth =  int(now.strftime("%d"))
      DayDelta = DayOfMonth - 1
      FirstDateOfMonth = now - timedelta(days=DayDelta)
      return FirstDateOfMonth.strftime("%Y-%m-%d")
    elif (DateType == DateFirstDayOfYear):
      now = datetime.now()
      DayOfYear =  int(now.strftime("%j"))
      DayDelta = DayOfYear - 1
      FirstDateOfYear = now - timedelta(days=DayDelta)
      return FirstDateOfYear.strftime("%Y-%m-%d")

  #except:
   #return '2014-01-01'    #Just returns a default date for before I was a jerk
#%j     Day of the year as a zero-padded decimal number.
#%d     Day of the month as a zero-padded decimal number.

####################################################################
#Main part of the code
#Database stuff
db = MySQLdb.connect("localhost", "username", "password", "database")   #host,user,password,database name
curs=db.cursor()

#Run a query for today
DateForQuery = GetADate(DateToday)
JerksQuery =  'SELECT exercise, SUM(count) FROM exercise WHERE tdate = "' + DateForQuery + '" GROUP BY exercise order by sum(count);'
print JerksQuery
curs.execute (JerksQuery)

#Form the HTML Table for today
OutString = CreateHTMLTable(curs, 'JERKS EXERCISE SUMMARY - TODAY')

#Run a query for yesterday
DateForQuery = GetADate(DateYesterday)
JerksQuery =  'SELECT exercise, SUM(count) FROM exercise WHERE tdate = "' + DateForQuery + '" GROUP BY exercise order by sum(count);'
print JerksQuery
curs.execute (JerksQuery)

#Form the HTML Table for today
OutString = OutString + CreateHTMLTable(curs, 'JERKS EXERCISE SUMMARY - YESTERDAY')

#Run a query for first day of this week
DateForQuery = GetADate(DateFirstDayOfWeek)
JerksQuery =  'SELECT exercise, SUM(count) FROM exercise WHERE tdate >= "' + DateForQuery + '" GROUP BY exercise order by sum(count);'
print JerksQuery
curs.execute (JerksQuery)

#Form the HTML table for this week
OutString = OutString + CreateHTMLTable(curs, 'JERKS EXERCISE SUMMARY - THIS WEEK (Since ' + DateForQuery + ')')

#Run a query for first day of this Month
DateForQuery = GetADate(DateFirstDayOfMonth)
JerksQuery =  'SELECT exercise, SUM(count) FROM exercise WHERE tdate >= "' + DateForQuery + '" GROUP BY exercise order by sum(count);'
print JerksQuery
curs.execute (JerksQuery)

#Form the HTML table for this week
OutString = OutString + CreateHTMLTable(curs, 'JERKS EXERCISE SUMMARY - THIS MONTH (Since ' + DateForQuery + ')')

#Run a query for the first day of this year
DateForQuery = GetADate(DateFirstDayOfYear)
JerksQuery =  'SELECT exercise, SUM(count) FROM exercise WHERE tdate >= "' + DateForQuery + '" GROUP BY exercise order by sum(count);'
print JerksQuery
curs.execute (JerksQuery)

#Form the HTML table for this week
OutString = OutString + CreateHTMLTable(curs, 'JERKS EXERCISE SUMMARY - THIS YEAR (Since ' + DateForQuery + ')')

#Form and run the query for the exercise table - all time
JerksQuery = 'SELECT exercise, SUM(count) FROM exercise GROUP BY exercise order by sum(count);'
curs.execute (JerksQuery)

#Form the HTML Table
OutString = OutString + CreateHTMLTable(curs, 'JERKS EXERCISE SUMMARY - ALL TIME')

#Form and run the query for the lookup table
JerksQuery = 'select * from ' + dbLookupTable + ' order by twoletters;'
#print JerksQuery
curs.execute (JerksQuery)

#Call the def to create a table
OutString = OutString + CreateHTMLTable(curs, 'JERKS EXERCISE SHORT CODES')

#Send the email
SendEmail('Jerks Summary at ' + GetDateTime(), OutString)


Sunday, 5 January 2014

An AirPi - Useful in a Powercut

In March 2013 I built a Raspberry Pi AirPi and I've had it up and running ever since.  The system has proved to be very reliable; I reckon it's only stopped working 2 or 3 times since I set it up.  The Python scripts are setup to run when the Pi starts so the AirPi will automatically start up if there's a power cut or glitch.

I do this by putting scripts in the /etc/init.d folder.  Here's an example:

#Used this as a guide http://myraspberrypiexperience.blogspot.co.uk/2012/08/star
t-vnc-automatically.html
#Run this under the Pi username
export USER='pi'
eval cd ~$USER

#Run the Airpi
su $USER -c 'sudo python /home/pi/Meteoros/pdw_upload_v3.py &'

#End stuff
exit 0

We've had some pretty wet and windy weather in the UK over the Christmas period (it's still poor as I write early in the new year) which has resulted in long power cuts all over the country.  We suffered a power cut at my house for 26 hours from roughly 1300 on 23/12/2013 to 1500 on 24/12/2013.  

Here's my AirPi barometric pressure chart for the period:


On the graph you can see the pressure suddenly drop; the weather conditions that coincided with this were high winds and heavy rain.  This caused trees to be blown over which caused a power cut to the place I live in which you can see on the graph as the horizontal line from the 23rd to the 24th.  A power cut means no power to the RasPi and no ADSL router, hence there are no measurements for this period.

The AirPi came in useful as we were due as a family to travel to my in-laws on the 24th for Christmas.  It's a reasonably long drive so we were due to leave at 0830ish on the 24th.  With the power out we decided to stay put as we didn't know what state the house would be in when the power came back on (i.e. freezer defrosted, lights left on).  However by 1200 the power was still off and with a long drive ahead of us we decided to give a key to neighbour, switch off everything we could, chuck out a load of food from the freezer and then crack on with the drive.

In the end the drive went well and we arrived before 1600.  Then, just after 1600 I got a Twitter direct message from my Raspberry Pi, (more on that later), which let me know that it was up and running again.  Shortly after I got a text from my neighbour to tell me that all was well with the house.

The next question was whether the heating would come on properly after the power cut; it would be a bad thing not to have this on during winter.  My AirPi gave me the answer as I could see the temperature in the house going up and down twice a day.  (I could monitor this remotely via Xixely).


It was interesting to look at the temperature profile, (chart for the 25th shown below):

The heating came on in the early hours of the morning and then early in the afternoon which matched the twice a day timer program I had set.  It heated up to roughly the expected temperature  (the thermostat was in another room and set to 19 Celsius).  It was good to see that the room heated up quicker than it cooled down which shows that the insulation must be doing some good.  What was interesting was the the heating was coming on several hours earlier than expected.  What I assumed (and later proved) was that when the power came on at 1600, the clock on the heating controller must have resumed at the time it held when the power went off(1300).  Hence the clock was running roughly 3 hours fast. 

It's also interesting to compare the fairly regular temperature profile while we were away (two peaks a day, a longer one in the afternoon) with one when we were at home the next week:

The "at home" peak is a lot more messy as we control the heating manually, tinker with the main thermostat and TRVs, open doors and windows etc.

I mentioned earlier that the thing that prompted me that the power was back on was a tweet from the Raspberry Pi. I have the Pi GET a temperature measurement from Xively and send it to me as a Twitter direct message (which I can pick up on my Android handset).  The fact that I get one of these every hour just tells me that the Pi is still up and working and it's also good for inter-geek boasting!

I used this utterly excellent document from the Raspberry Pi Foundation to tell me how to tweet from the Pi using Python (see page 115).  The code is below (secret values edited out) but in simple terms, every hour it picks up the latest temperature reading from Xively and posts it as a Twitter direct message.  It uses the twitter Python module.  Here's a screenshot:


#Using Twitter to communicate COSM values
#Example URL is http://api.cosm.com/v2/feeds/XXXXX.csv?datastreams=0
#This returns the last value for datastream 0
import os
from twitter import *
import time
from datetime import datetime
from httplib import HTTP

#The URL we will use
COSMURL = "api.cosm.com"
FullCOSMURL = "http://api.cosm.com/v2/feeds/104017.csv?datastreams=0"
KeyToUse = <Deleted>

#Make a HTTP request to COSM to get a string
def GetCOSM():
  try:
    #Now do the HTTP magic - Connect to the server
    h = HTTP(COSMURL)

    #Do a get
    h.putrequest('GET',FullCOSMURL)

    # setup the API Key
    h.putheader('X-ApiKey',KeyToUse)

    # we're done with the headers....
    h.endheaders()

    #Get the response
    errcode, errmsg, headers = h.getreply()
    response = h.getfile()
    data = response.read()
    h.close()
    print data
    return data
  #Catch an exception
  except Exception, err:
    #Write a log with the error
    print "Got us an exception: " + str(err)

#MAIN BODY OF CODE
#Go in to a loop sending direct messages
while True:
  #Using the @mrjamesbond account to send tweets
  #Went to https://dev.twitter.com/apps/new to set this up
  CONSUMER_KEY = <Deleted>
  CONSUMER_SECRET = <Deleted>

  # get full pathname of .twitterdemo_oauth file in the
  # home directory of the current user
  oauth_filename = os.path.join(os.path.expanduser('~'),'.twitterdemo_oauth')

  # get twitter account login info
  if not os.path.exists(oauth_filename):
    oauth_dance('Raspberry Pi Twitter Demo', CONSUMER_KEY, CONSUMER_SECRET, oauth_filename)
  (oauth_token, oauth_token_secret) = read_token_file(oauth_filename)

  # log in to Twitter
  auth = OAuth(oauth_token, oauth_token_secret, CONSUMER_KEY, CONSUMER_SECRET)
  twitter = Twitter(auth=auth)
  try:
   #Send a direct message
   MessageToSend = "AirPi Temperature Reading " + GetCOSM()
   #print MessageToSend
   twitter.direct_messages.new(user="pauldavidweeks",text=MessageToSend)

   # Tweet a new status update
   #twitter.statuses.update(status=MessageToSend)

   # Display all my tweets
   #for tweet in twitter.statuses.user_timeline():
     #print('Created at',tweet['created_at'])
     #print(tweet['text'])
     #print('-'*80)
  except:
    print "Got a Twitter error"

  time.sleep(3600)