Showing posts with label stats. Show all posts

Sunday, 19 April 2015

Sleep Analysis Using Raspberry Pi and Fitbit API

In a previous blog post I created a sleep infographic using my Raspberry Pi to extract data from the Fitbit API.  For this I used summary data but at the time I spotted that the API response contains a value for every single minute that I spent in bed.  Full Python code for how I accessed and logged this data is contained on that previous post.

This post uses OAUTH1.0 to access the Fitbit API.  I've now "upgraded" to using OAUTH2.0.  Click here for a how-to guide.

The data in the JSON response to the Fitbit API looks like this in it's raw format:

u'minuteData': [{u'value': u'2', u'dateTime': u'22:14:30'}, {u'value': u'1', u'dateTime': u'22:15:30'}, {u'value': u'1', u'dateTime': u'22:16:30'}, {u'value': u'1', u'dateTime': u'22:17:30'}

...and when I process it into a summary file it looks like this:

2015-01-27,22:21:00,3
2015-01-27,22:22:00,2
2015-01-27,22:23:00,2
2015-01-27,22:24:00,2
2015-01-27,22:25:00,2
2015-01-27,22:26:00,1
2015-01-27,22:27:00,1
2015-01-27,22:28:00,1

So the first value is the date, the second value is the time and the third value is the sleep state value logged by Fitbit.  Looking at the API documentation it states these are:
  • 1 is asleep
  • 2 is awake
  • 3 is really awake
Which are slightly different to the values shown on sleep charts the Fitbit app.  Overall the values are:

Value API Doc Says Fitbit App says
1 Asleep Asleep
2 Awake Restless
3 Really Awake Awake

I analysed data for the period 27/02/2015 until 19/04/2015 which was 39,030 data points.  Breaking this down by result type I got:

ValueCountPercentage
135,20890.2%
23,2248.3%
35981.5%

So I spend more than 90% of my time in bed asleep.  This is a good thing!

I was most interested in the times that my Fitbit says I am awake; specifically analysing times when I'm awake at night when I'd rather be asleep!  Over a couple of nights, when answering the call of nature, I satisfied myself that the times when Fitbit said I was awake, I actually was awake.

So taking the raw output and putting it into Excel I:

  • Just looked at data points with a sleep value of "3" (so awake).
  • Just looked for the time period midnight to 05:00 (as there's bound to be lots of 3s at bed time and getting up time).

Taking this filtered data and plotting it a graph with the date on the x-axis and time of day on the y-axis I got this chart:


Now I'm not the greatest at interpreting graphs like this but I thought there was a definite clustering at the bottom of the graph.  This is highlighted below:


But there was only one way to prove it! A histogram showing the frequency of the times when I'm awake.  Using half hour buckets I got:


So 19.8% of the times I was awake during the night was during the period Midnight to 00:30:00. Scanning the table, it's clear to see that there's a much higher frequency of me being awake during the midnight to 02:30:00 period than from 02:30:00 until 05:00:00.  A graph makes this clear to see:


I think there's a relatively simple explanation for this pattern.  I tend to wake up each and every night to answer the call of nature (after having previously done so just before bed) and this act is reflected in the higher frequency of being awake for the first 2.5 hours after midnight.  I'm then able to settle down for a relatively solid sleep for the next 2.5 hours.

So far, so reasonably interesting (for Geeks).  At the start of this month we swapped from UTC to British Summer Time in the UK so I thought it would be interesting to see what impact this had on my "call-of-nature" induced wake-up time.  Specifically, would the clocks going forward an hour shift my wake up pattern?  This would tell me whether my night time visits to the smallest room were body clock driven or just time elapsed since my last drink.  

It's been 21 days since daylight saving time was introduced so I just picked out data 21 days either side of this point.  This gave me this chart when date and time of day are plotted:


To me it does look like there's a cluster of points later in the night after daylight saving time was introduced.  Again, let's do a frequency analysis and plot the results on a chart:


The chart is interesting, if not conclusive:
  • There's been a massive drop in the frequency of being awake during the 00:30:00 to 01:00:00 period.
  • There's been a massive spike in the frequency of being awake in the 02:00:00 to 02:30:00 period.

Looking back at the previous chart, I would say the 02:30:00 spike is down to just a single day, 14/04/2015 when I was awake for 15 minutes during the night.   I would say that the number of data points (135 in total) is not enough to draw a conclusion, being too easily skewed by one anomalous night. 

I might just sharpen up my stats skills and have another look at this to see if something of statistical significance can be observed.  All tips put in the comments section below are welcomed!!


Thursday, 2 April 2015

Exercise Analytics Using Raspberry Pi, MySQL and APIs

Many of the posts I've been doing since the end of 2014 have been about using exercise API data and exercise database data to ensure I keep fit and healthy.  Key examples are:


This has taught me a lot about myself, in particular the need to set myself targets and periodically measure myself against these targets.  Back in early January 2015 I sent myself an email with this set of targets in it:


It's one quarter into the year, it's time to see how I'm doing against the targets.  First I needed to calculate a set of targets for the quarter.  I did this as Year / 4 rounded up to the nearest integer.  This makes the targets:


(Fitbit based Steps - St and Sleep - Sl have been "pro-rated" as I only got the device at the end of January).

So taking each exercise type in turn, here's how I got the data to compare with the targets.

Strava Data
This is cycling, swimming and running data logged using my Garmin sports watch and uploaded to Strava.

For this I wrote a Python script to extract information from the Strava API.  Full code at the bottom of this post but here's some highlights.

A obtained all the data with a single URL request to the Strava API:
urllib2.urlopen('https://www.strava.com/api/v3/activities?access_token=' + StravaToken + '&per_page=200&after=' + TheUnixTime).read()

Here the per_page=200 entity reference means give me 200 records (more than enough for my Strava efforts) and after= means give all records after the specified period (which is defined in Unix time).

The resulting JSON defeated all my ham-fisted attempts to parse using simple methods so I ended up using the json Python module.  This made life a lot easier!  So with:

StravaJSON = json.loads(StravaText)to access the JSON structures.

...and the likes of ...

StravaJSON[i]['type'] to access specific fields.

...it was easy enough to loop through the whole set of records, pick out all the swims, runs and cycles, add together the distances and write the results.  The output was:

pi@raspberrypi ~/exercise $ sudo python strava_v1.py
Swim Count: 13. Swim Distance: 15600.0
Bike Count: 28. Bike Distance: 282693.4
Run Count: 12. Run Distance: 68337.6

(All distances in metres)

Jerks Exercises
Previously I blogged on how I used a MySQL database on my raspberry Pi to log "physical jerks" (e.g. press ups and sits ups).  I communicate these using a simple code sent in a tweet.

Getting all the data is as simple as running an SQL query.  Here's what I got:

mysql> SELECT exercise, SUM(count) FROM exercise where tdate >= "2015-01-01" GROUP BY exercise order by sum(count);
+--------------------+------------+
| exercise           | SUM(count) |
+--------------------+------------+
| Pilates            |         13 |
| Yoga               |         13 |
| Leg Weights        |         16 |
| Hundred Ups        |         19 |
| General Stretching |         23 |
| Foam Rolling       |         25 |
| Squatting          |        112 |
| Arm Raises         |        322 |
| Side Raises        |        322 |
| Clap Press Ups     |        328 |
| Bicep Curls        |        342 |
| Shoulder Press     |        367 |
| Tricep Curls       |        374 |
| Sit Ups            |        789 |
| Abdominal Crunches |       1429 |
| Press Ups          |       1501 |
| Calf Raises        |       1839 |
+--------------------+------------+

Easy!

Fitbit Data
For the sleep data from my Fitbit Charge HR I re-used code that I used for my sleep infographic.  This gave me a per day sleep figure that I simply summed to give me the total sleep for the period.

For steps data (and floors climbed data) I simply modified the sleep code to 1)access the activities resource and 2)pull out the steps and floors data.  Full code below.  Key parts were getting activity data from the API using fitbit-python:

fitbit_data = authd_client._COLLECTION_RESOURCE('activities',DateForAPI)

.and extracting steps and floors from the resulting JSON:

#Get the total steps value
TotalSteps = fitbit_data['summary']['steps']

#Get the total floors value
TotalFloors = fitbit_data['summary']['floors']

Again I simply summed the data from the summary file to give me the single figure I needed.

Overall Result
Here's a table with the overall result.  Green means target met or exceeded, red means not met.


Observations:

  • I nailed all the "counting" targets
  • I missed all the harder qualitative targets (e.g. cycling and running speed).
  • Some counting targets I only just sneaked in (e.g. Yoga and Pilates).  This is generally stuff I don't like doing.
  • Some counting targets I exceeded by a fair amount (e.g. press ups).  These are things I like doing!

So I need to find a way to beat the speed targets I set.  How can technology help me with that??

(I've also added a new target for floors climbed based upon my Q1 daily average).

Strava - Code

import urllib2
import json

#Constants - For Strava
StravaToken = '<Key Here>'


#From http://www.onlineconversion.com/unix_time.htm
TheUnixTime = '1420070400'

#Access the Strava API using a URL
StravaText = urllib2.urlopen('https://www.strava.com/api/v3/activities?access_token=' + StravaToken + '&per_page=200&after=' + TheUnixTime).read()
#print StravaText

#Parse the output to get all the information.  Set up some variables
SwimCount = 0
SwimDistance = 0
RunCount = 0
RunDistance = 0
BikeCount = 0
BikeDistance = 0

#See how many Stravas there are.  Count the word 'name' as there's one per record
RecCount = StravaText.count('name')

#Load the string as a JSON to parse
StravaJSON = json.loads(StravaText)

#Loop through each one
for i in range(0,RecCount):
  #See what type it was and process accordingly
  if (StravaJSON[i]['type'] == 'Swim'):
    SwimCount = SwimCount + 1
    SwimDistance = SwimDistance + StravaJSON[i]['distance']
  elif (StravaJSON[i]['type'] == 'Ride'):
    BikeCount = BikeCount + 1
    BikeDistance = BikeDistance + StravaJSON[i]['distance']
  elif (StravaJSON[i]['type'] == 'Run'):
    RunCount = RunCount + 1
    RunDistance = RunDistance + StravaJSON[i]['distance']

#Print results
print 'Swim Count: ' + str(SwimCount) + '. Swim Distance: ' + str(SwimDistance)
print 'Bike Count: ' + str(BikeCount) + '. Bike Distance: ' + str(BikeDistance)
print 'Run Count: ' + str(RunCount) + '. Run Distance: ' + str(RunDistance)


Fitbit - Code

import fitbit
from datetime import datetime, timedelta
import time

#Constants
CLIENT_KEY = '<Yours Here>'
CLIENT_SECRET = '<Yours Here>'
USER_KEY = '<Yours Here>'
#USER_KEY = '<Yours Here>'
USER_SECRET = '<Yours Here>'

#The first date I used Fitbit
FirstFitbitDate = '2015-01-27'

#Determine how many days to process for.  First day I ever logged was 2015-01-27
def CountTheDays():
  #See how many days there's been between today and my first Fitbit date.
  now = datetime.now()                                         #Todays date
  FirstDate = datetime.strptime(FirstFitbitDate,"%Y-%m-%d")    #First Fitbit date as a Python date object

  #Calculate difference between the two and return it
  return abs((now - FirstDate).days)

#Produce a date in yyyy-mm-dd format that is n days before today's date (where n is a passed parameter)
def ComputeADate(DaysDiff):
  #Get today's date
  now = datetime.now()

  #Compute the difference betwen now and the day difference paremeter passed
  DateResult = now - timedelta(days=DaysDiff)
  return DateResult.strftime("%Y-%m-%d")

#Get a client
authd_client = fitbit.Fitbit(CLIENT_KEY, CLIENT_SECRET, resource_owner_key=USER_KEY, resource_owner_secret=USER_SECRET)

#Find out how many days to compute for
DayCount = CountTheDays()

#Open a file to write the output - minute by minute and summary
SummaryFileToWrite = '/home/pi/exercise/' + 'summary_' + datetime.now().strftime("%Y-%m-%d") + '.csv'
SummaryFile = open(SummaryFileToWrite,'w')

#Process each one of these days stepping back in the for loop and thus stepping up in time
for i in range(DayCount,-1,-1):
  #Get the date to process
  DateForAPI = ComputeADate(i)

  #Tell the user what is happening
  print 'Processing this date: ' + DateForAPI

  #Get sleep
  fitbit_data = authd_client._COLLECTION_RESOURCE('activities',DateForAPI)

  #Get the total steps value
  TotalSteps = fitbit_data['summary']['steps']

  #Get the total floors value
  TotalFloors = fitbit_data['summary']['floors']

  #Write a log of summary data
  SummaryFile.write(DateForAPI + ',' + str(TotalSteps) + ',' + str(TotalFloors) + ',' '\r\n')

  #Wait a bit (for API rate limit)
  time.sleep(1.1)

#We're now at the end of the loop.  Close the file
SummaryFile.close()


Tuesday, 24 March 2015

Sleep Infographic Using Raspberry Pi and Fitbit API

Infographics.  They're everywhere.  Here's one I did (it's my first one so be kind!):


So why did I do this?  In a previous post I spotted how the Fitbit API contains lots of delicious Geek data for me to analyse.  Hence I wanted to extract this data, analyse it and present it.  My inclination is to present  detailed charts and tables of data but I decided to present it as an infographic as they seem to be everywhere these days.

In terms of my Fitbit Charge HR and sleep measurement, I think it's reasonably accurate.  If I've had a good night sleep then this is generally registered.  Similar for a bad nights sleep.  When I get up in the night  to answer nature's call it's always logged.  Needs more analysis to be sure though...

So the process was:
  • Write a Python script on my Raspberry Pi to access the Fitbit API.
  • Have the script output data in a raw format.
  • Use Excel to process and present the data.  

Full code is at the bottom but highlights from it are summarised below.

Accessing the API
Uses methods described in this previous post.  Snippet:

#Get a client
authd_client = fitbit.Fitbit(CLIENT_KEY, CLIENT_SECRET, resource_owner_key=USER_KEY, resource_owner_secret=USER_SECRET)

Calculating How Many Days to Process For
The Fitbit API takes a single date as a parameter.  I wanted to process for every day that I'd had the Fitbit.  Hence I wrote a function called CountTheDays() to count how many days had passed between the day the script is run and the day I got my Fitbit.

Looping through Each Day
Having the number of days to process for, I could then create a for loop to look at each day in turn.  

This snippet:

for i in range(DayCount,-1,-1):
  #Get the date to process
  DateForAPI = ComputeADate(i)

Means you loop with the loop var i decrementing each time.  It starts off back at the first day I got the Fitbit and finishes on today's date.

The code then gets an actual date using ComputeADate(i) which means it computes a date that is i days different from today.

Getting the API Data
This method gets the API data for you:
fitbit_sleep = authd_client._COLLECTION_RESOURCE('sleep',DateForAPI)

...and the resulting JSON structure starts like this:
{u'sleep': [{u'logId': 778793259, u'isMainSleep': True, u'minutesToFallAsleep': 0, u'awakeningsCount': 26, u'minutesAwake': 45, u'timeInBed': 483, u'minutesAsleep': 417, u'awakeDuration': 11, u'efficiency': 90, u'startTime': u'2015-03-16T22:18:00.000', u'restlessCount': 29, u'duration': 28980000, u'restlessDuration': 52, u'minuteData': 

....has a bunch of "per minute" records like this....

{u'value': u'1', u'dateTime': u'22:38:00'}, {u'value': u'1', u'dateTime': u'22:39:00'}, {u'value': u'1', u'dateTime': u'22:40:00'}

...then finishes with more summary data like this.

u'awakeCount': 3, u'minutesAfterWakeup': 1}], u'summary': {u'totalTimeInBed': 483, u'totalMinutesAsleep': 417, u'totalSleepRecords': 1}}

Extracting Elements of the JSON
Using my patented trial and error method I managed to work out you pick out different parts of the JSON like this:

#Get the total minutes in bed value.  This will control our loop that gets the sleep
MinsInBed = fitbit_sleep['sleep'][0]['timeInBed']

#Get the total sleep value
MinsAsleep = fitbit_sleep['sleep'][0]['minutesAsleep']

...and that the [timeInBed] field could be used to determine how many per minute records there are.  Hence you can loop, logging each of the per minute records:

#Loop through the lot
  for i in range(0,MinsInBed):
    SleepVal = fitbit_sleep['sleep'][0]['minuteData'][i]['value']
    TimeVal = fitbit_sleep['sleep'][0]['minuteData'][i]['dateTime']
    MyFile.write(DateForAPI + ',' + TimeVal + ',' + SleepVal + '\r\n')
    
If this is the first loop iteration, grab the time which is when Fitbit thought I went to bed:

    if (i == 0):
      FirstTimeInBed = TimeVal

Logging to File
In the loop above I log the per minute data to file.  I also log summary data to file like this:

#Write a log of summary data
  SummaryFile.write(DateForAPI + ',' + str(MinsInBed) + ',' + str(MinsAsleep) + ',' + FirstTimeInBed + '\r\n')

One of these logs is written per day.

Analysing the Summary Data
I'll leave analysis of the per minute data until later, (can't think what to do with it now).  The summary data looks like this:

2015-01-27,478,434,22:21:00
2015-01-28,447,420,22:50:00
2015-01-29,491,446,22:11:00
2015-01-30,414,359,23:29:00


The format is:
<Date>,<Minutes in bed>,<Minutes asleep>,<Bed Time>

So for the infographic I used Excel to:

1-Add up all the time asleep values to give the total time asleep (expressed in hours).

2-Worked out the average time asleep each night (again expressed in hours).

3-Used a pivot table to examine the data on a per day of week basis.


So the Saturday to Sunday sleep is my best at a mean of 7.6 hours.  Sunday to Monday sleep is the worst at 5.8 hours (this is because I do a swim training session which finishes late on a Sunday night so I go to bed later and am also a bit wired so it takes me longer to get to sleep). 

4-Worked out an "efficiency" figure by calculating what proportion of time in bed I'm actually asleep for.

5-Looked at the frequency distribution of Fitbit logged bed time:


The mode value of 22:12 went on the infographic.  Latest bed time is still before midnight.  Rock 'n' roll baby!

Full Code
Secret stuff changed of course.  Look at my previous posts to see how to authenticate etc.

#V1 - Minute by minute data
#V2 - Summary data added

import fitbit
from datetime import datetime, timedelta

#Constants
CLIENT_KEY = 'uptownfunkyouup'
CLIENT_SECRET = 'livinlifeinthecity'
USER_KEY = 'iliketomoveitmoveit'
#USER_KEY = 'iliketomoveitmove'
USER_SECRET = 'iliketohuhmoveit'

#The first date I used Fitbit
FirstFitbitDate = '2015-01-27'

#Determine how many days to process for.  First day I ever logged was 2015-01-27
def CountTheDays():
  #See how many days there's been between today and my first Fitbit date.
  now = datetime.now()                                         #Todays date
  FirstDate = datetime.strptime(FirstFitbitDate,"%Y-%m-%d")    #First Fitbit dat
e as a Python date object

  #Calculate difference between the two and return it
  return abs((now - FirstDate).days)

#Produce a date in yyyy-mm-dd format that is n days before today's date (where n is a passed parameter)
def ComputeADate(DaysDiff):
  #Get today's date
  now = datetime.now()

  #Compute the difference betwen now and the day difference paremeter passed
  DateResult = now - timedelta(days=DaysDiff)
  return DateResult.strftime("%Y-%m-%d")

#Get a client
authd_client = fitbit.Fitbit(CLIENT_KEY, CLIENT_SECRET, resource_owner_key=USER_KEY, resource_owner_secret=USER_SECRET)

#Find out how many days to compute for
DayCount = CountTheDays()

#Open a file to write the output - minute by minute and summary
FileToWrite = '/home/pi/sleep/' + 'minuteByMinute_' + datetime.now().strftime("%Y-%m-%d") + '.csv'
MyFile = open(FileToWrite,'w')
SummaryFileToWrite = '/home/pi/sleep/' + 'summary_' + datetime.now().strftime("%Y-%m-%d") + '.csv'
SummaryFile = open(SummaryFileToWrite,'w')

#Process each one of these days stepping back in the for loop and thus stepping up in time
for i in range(DayCount,-1,-1):
  #Get the date to process
  DateForAPI = ComputeADate(i)

  #Tell the user what is happening
  print 'Processing this date: ' + DateForAPI

  #Get sleep
  fitbit_sleep = authd_client._COLLECTION_RESOURCE('sleep',DateForAPI)

  #Get the total minutes in bed value.  This will control our loop that gets the sleep
  MinsInBed = fitbit_sleep['sleep'][0]['timeInBed']

  #Get the total sleep value
  MinsAsleep = fitbit_sleep['sleep'][0]['minutesAsleep']

  #Loop through the lot
  for i in range(0,MinsInBed):
    SleepVal = fitbit_sleep['sleep'][0]['minuteData'][i]['value']
    TimeVal = fitbit_sleep['sleep'][0]['minuteData'][i]['dateTime']
    MyFile.write(DateForAPI + ',' + TimeVal + ',' + SleepVal + '\r\n')
    #If this is the first itteration of the loop grab the time which says when I got to bed
    if (i == 0):
      FirstTimeInBed = TimeVal

  #Write a log of summary data
  SummaryFile.write(DateForAPI + ',' + str(MinsInBed) + ',' + str(MinsAsleep) + ',' + FirstTimeInBed + '\r\n')
#We're now at the end of theloops.  Close the file
MyFile.close()
SummaryFile.close()


Saturday, 24 January 2015

Raspberry Pi - Python - MySQL - Cron Jobs and Physical Jerks #2

In a previous posting I described how I used Twitter, Python and MySQL to capture and log my exercise habits (what I like to call physical jerks).

What I've learnt about myself over the years is that to keep exercising regularly I need:

  • Gratification, i.e. something to say "well done" when I've done some exercise (a la Strava Kudos).
  • Having some fun data to play with.
  • Nagging, i.e. something to keep telling me to do my exercises. 
  • Targets

I talked about gratification in my last Jerks post.  When I do exercise, I tweet, my Raspberry Pi picks this up and sends me a Twitter DM to say "well done".  Example:


When it comes to fun data, it's a virtuous circle.  I exercise more and get fitter, I get more fun data. I want more fun data, I exercise more and get fitter.  At the time of writing the database looks something like this:

mysql> SELECT exercise, SUM(count) FROM exercise GROUP BY exercise order by sum(count);
+--------------------+------------+
| exercise           | SUM(count) |
+--------------------+------------+
| Yoga               |          7 |
| Pilates            |          7 |
| Leg Weights        |         10 |
| Hundred Ups        |         11 |
| Foam Rolling       |         16 |
| General Stretching |         16 |
| Squatting          |         55 |
| Side Raises        |        169 |
| Arm Raises         |        169 |
| Bicep Curls        |        176 |
| Shoulder Press     |        182 |
| Tricep Curls       |        239 |
| Clap Press Ups     |        263 |
| Sit Ups            |        335 |
| Abdominal Crunches |        578 |
| Press Ups          |        872 |
| Calf Raises        |       1384 |
+--------------------+------------+
17 rows in set (0.13 sec)

When it comes to nagging, this is what I've been working on recently.  I decided to create a Python script that would periodically email with details of:
  • Jerks I've done today
  • Jerks I did yesterday
  • Jerks I've done this week
  • Jerks I've done this month
  • Jerks I've done this year
  • All time Jerks
The SQL for this is pretty basic, (similar to that laid out above but with date parameters).  The first thing I needed to do was be able to look at today's date and calculate some other dates as offsets to it (i.e. date yesterday, date of start of week, date of start of year).  Here's an example for start of week from the GetADate function (full code below):

 elif (DateType == DateFirstDayOfMonth):
      now = datetime.now()
      DayOfMonth =  int(now.strftime("%d"))
      DayDelta = DayOfMonth - 1
      FirstDateOfMonth = now - timedelta(days=DayDelta)
      return FirstDateOfMonth.strftime("%Y-%m-%d")

This uses the "%d" attribute for strftime to return the number associated with the day of month.  e.g. would return 24 for today, the 24th of January.  It then uses the timedelta method (imported from datetime) with an offset of the day number minus 1 (so 23 in my example) to calculate the date of the first day of the month.  This is then returned to be used in the SQL.

The email I create is formed from HTML so there's a function (CreateHTMLTable) that takes an SQL cursor as an attribute and forms a heading plus HTML table.  It does this no matter how many columns or rows in the SQL response.  This results in a HTML segment, albeit with no indentation.

I send the email using methods from the smtplib module.  There's plenty of examples of how to do this on the interweb.  I used this one from Stack Overflow that shows how to create HTML and text emails.  The full code is shown below in the SendEmail function and is pretty self-explanatory.  What I did find is that when I tried to use my Gmail and Outlook.com accounts to send the email, these providers did not "like" me using this method to send.  Gmail blocked it out-right, telling me to lower  my privacy settings to continue (which I didn't).  Outlook.com kept asking me to re-authenticate my account which was a pain.  I ended up using an old, unused email account from my ISP which seems to less restrictions.  (It's re-assuring that Google and Microsoft have implemented these feature).

So a cron job runs the script every hour (from 8am to 10pm at weekends and 6pm to 10pm on weekdays).  The email comes to my smartphone and,  as I'm basically addicted to it, I pick it up pretty quickly.  The first email of the day is often something like this which is a big insulting nag to do something:


...but then I get emails like this which is like "get in, did more today than yesterday":


Then I get a series of interesting summaries like these:


...and these:


Followed by a reminder of the short codes for the TUI:

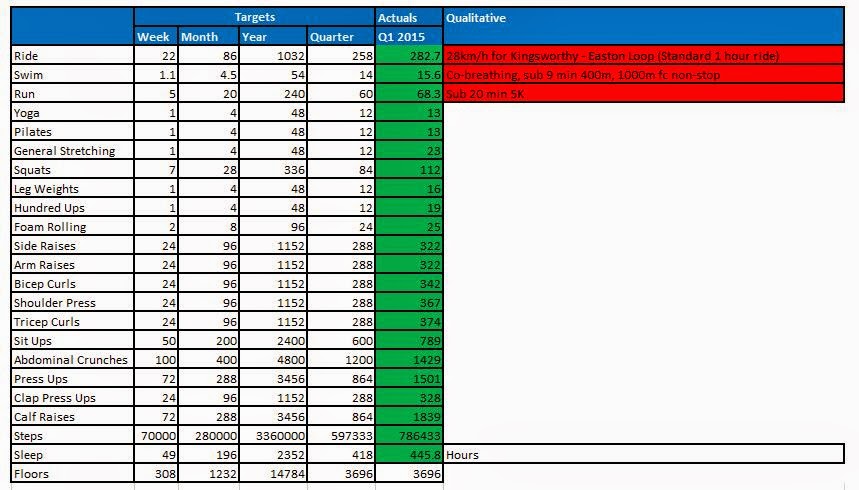
So that just leaves the targets.  I set these at the start of the year:


...but currently have to manually compare actuals with targets.  Sounds like another Geek Dad project to create a nagging capability that includes targets...

Full code listing:

#V1 - First version with exercise table summary
#V2 - Second version with HTML tables and lookup summary
#V3 - Added more summaries and a def to create tables
#V4 - Finished the summaries and formatting changes

#Sends a summary email of Jerks exercise
from datetime import datetime, timedelta
import smtplib
import MySQLdb

#MIME multipart stuff
from email.mime.multipart import MIMEMultipart
from email.mime.text import MIMEText

#Email Constants
smtpserver = 'SMTP Server Here'
AUTHREQUIRED = 1 # if you need to use SMTP AUTH set to 1
smtpuser = 'SMTP Username Here'  # for SMTP AUTH, set SMTP username here
smtppass = 'SMTP Password Here'  # for SMTP AUTH, set SMTP password here
RECIPIENTS = 'Receiving address Here'
SENDER = 'Sending address Here'

#Database related contents
dbMainTable = "exercise"
dbLookupTable = "lookup"

#Date manipulation related constants
DateToday = 'DateToday'
DateYesterday = 'DateYesterday'
DateFirstDayOfWeek = 'DateFirstDayOfWeek'
DateFirstDayOfMonth = 'DateFirstDayOfMonth'
DateFirstDayOfYear = 'DateFirstDayOfYear'

#Gets a initial timestampt for emails
def GetDateTime():
  #Get the time, format it and return it
  now = datetime.now()
  return str(now.date()) + ' ' + str(now.strftime("%H:%M:%S"))

#Send an email
def SendEmail(TheSubject,TheMessage):
  #Form the message
  #msg = "To:%s\nFrom:%s\nSubject: %s\n\n%s" % (RECIPIENTS, SENDER, TheSubject, TheMessage)

  #Start forming the MIME Multipart message
  msg = MIMEMultipart('alternative')
  msg['Subject'] = TheSubject
  msg['From'] = SENDER
  msg['To'] = RECIPIENTS

  # Record the MIME types of both parts - text/plain and text/html.
  #part1 = MIMEText(text, 'plain')
  part2 = MIMEText(TheMessage, 'html')

  # Attach parts into message container.
  # According to RFC 2046, the last part of a multipart message, in this case
  # the HTML message, is best and preferred.
  #msg.attach(part1)
  msg.attach(part2)

  #print msg

  #Do the stuff to send the message
  server = smtplib.SMTP(smtpserver,587)
  server.ehlo()
  #server.starttls()
  server.ehlo()
  server.login(smtpuser,smtppass)
  server.set_debuglevel(1)
  server.sendmail(SENDER, [RECIPIENTS], msg.as_string())
  server.quit()

#Creates a string with a HTML table and a heading based upon parameters sent
def CreateHTMLTable(InDBResult, InTitle):
  try:
    #Start with the heading
    OutString = '<H2>' + InTitle + '</H2>\r\n'

    #See if there is anything to write
    if (InDBResult.rowcount > 0):
      #Add the table opening tag
      OutString = OutString + '<table border="1">\n\r'

      #Loop through each of the database rows, adding table rows
      for row in InDBResult:
        #New table row
        OutString = OutString + '<tr>\r\n'
        #Add the table elements
        for DBElement in row:
          OutString = OutString + '<td>' + str(DBElement) + '</td>\r\n'

        #Close the table row
        OutString = OutString + '</tr>\r\n'

      #Close the table tag
      OutString = OutString + '</table>\r\n'
      #Return the result
      return OutString
    else:
      OutString = OutString + '<p>No database results for this time period.  Come on Jerk!</p>\r\n'
      return OutString
  except:
    return 'Error creating HTML table.\r\n'

#Returns a date based upon the parameter supplied
def GetADate(DateType):
  #try:
    if (DateType == DateToday):    #Just get and return todays date
      #Get the time, format it and return it
      now = datetime.now()
      return now.strftime("%Y-%m-%d")
    elif (DateType == DateYesterday):
      now = datetime.now()
      TheDateYesterday = now - timedelta(days=1)
      return TheDateYesterday.strftime("%Y-%m-%d")
    elif (DateType == DateFirstDayOfWeek):   #The first day of the current week.  Sunday is 0. Monday is 1 etc.  We want to know how many days from Monday it is
      #Find what day of the week it is
      now = datetime.now()
      DayOfWeek = int(now.strftime("%w"))   #Get the number of the day of the week
      print 'Day of week ->>' + str(DayOfWeek)
      #See what to subtract.  Sunday is a special case
      if (DayOfWeek == 0):
        DayDelta = 6         #Monday was always 6 days ago on a Sunday!
      else:
        DayDelta = DayOfWeek - 1
      print 'Day delta ->>' + str(DayDelta)
      DateOfMonday = now - timedelta(days=DayDelta)
      print 'Monday was ->>' + str(DateOfMonday)
      return DateOfMonday.strftime("%Y-%m-%d")
    elif (DateType == DateFirstDayOfMonth):
      now = datetime.now()
      DayOfMonth =  int(now.strftime("%d"))
      DayDelta = DayOfMonth - 1
      FirstDateOfMonth = now - timedelta(days=DayDelta)
      return FirstDateOfMonth.strftime("%Y-%m-%d")
    elif (DateType == DateFirstDayOfYear):
      now = datetime.now()
      DayOfYear =  int(now.strftime("%j"))
      DayDelta = DayOfYear - 1
      FirstDateOfYear = now - timedelta(days=DayDelta)
      return FirstDateOfYear.strftime("%Y-%m-%d")

  #except:
   #return '2014-01-01'    #Just returns a default date for before I was a jerk
#%j     Day of the year as a zero-padded decimal number.
#%d     Day of the month as a zero-padded decimal number.

####################################################################
#Main part of the code
#Database stuff
db = MySQLdb.connect("localhost", "username", "password", "database")   #host,user,password,database name
curs=db.cursor()

#Run a query for today
DateForQuery = GetADate(DateToday)
JerksQuery =  'SELECT exercise, SUM(count) FROM exercise WHERE tdate = "' + DateForQuery + '" GROUP BY exercise order by sum(count);'
print JerksQuery
curs.execute (JerksQuery)

#Form the HTML Table for today
OutString = CreateHTMLTable(curs, 'JERKS EXERCISE SUMMARY - TODAY')

#Run a query for yesterday
DateForQuery = GetADate(DateYesterday)
JerksQuery =  'SELECT exercise, SUM(count) FROM exercise WHERE tdate = "' + DateForQuery + '" GROUP BY exercise order by sum(count);'
print JerksQuery
curs.execute (JerksQuery)

#Form the HTML Table for today
OutString = OutString + CreateHTMLTable(curs, 'JERKS EXERCISE SUMMARY - YESTERDAY')

#Run a query for first day of this week
DateForQuery = GetADate(DateFirstDayOfWeek)
JerksQuery =  'SELECT exercise, SUM(count) FROM exercise WHERE tdate >= "' + DateForQuery + '" GROUP BY exercise order by sum(count);'
print JerksQuery
curs.execute (JerksQuery)

#Form the HTML table for this week
OutString = OutString + CreateHTMLTable(curs, 'JERKS EXERCISE SUMMARY - THIS WEEK (Since ' + DateForQuery + ')')

#Run a query for first day of this Month
DateForQuery = GetADate(DateFirstDayOfMonth)
JerksQuery =  'SELECT exercise, SUM(count) FROM exercise WHERE tdate >= "' + DateForQuery + '" GROUP BY exercise order by sum(count);'
print JerksQuery
curs.execute (JerksQuery)

#Form the HTML table for this week
OutString = OutString + CreateHTMLTable(curs, 'JERKS EXERCISE SUMMARY - THIS MONTH (Since ' + DateForQuery + ')')

#Run a query for the first day of this year
DateForQuery = GetADate(DateFirstDayOfYear)
JerksQuery =  'SELECT exercise, SUM(count) FROM exercise WHERE tdate >= "' + DateForQuery + '" GROUP BY exercise order by sum(count);'
print JerksQuery
curs.execute (JerksQuery)

#Form the HTML table for this week
OutString = OutString + CreateHTMLTable(curs, 'JERKS EXERCISE SUMMARY - THIS YEAR (Since ' + DateForQuery + ')')

#Form and run the query for the exercise table - all time
JerksQuery = 'SELECT exercise, SUM(count) FROM exercise GROUP BY exercise order by sum(count);'
curs.execute (JerksQuery)

#Form the HTML Table
OutString = OutString + CreateHTMLTable(curs, 'JERKS EXERCISE SUMMARY - ALL TIME')

#Form and run the query for the lookup table
JerksQuery = 'select * from ' + dbLookupTable + ' order by twoletters;'
#print JerksQuery
curs.execute (JerksQuery)

#Call the def to create a table
OutString = OutString + CreateHTMLTable(curs, 'JERKS EXERCISE SHORT CODES')

#Send the email
SendEmail('Jerks Summary at ' + GetDateTime(), OutString)