Showing posts with label strava. Show all posts

Monday, 23 January 2017

Amazon Alexa Skill with Python and Strava API

In my last post I described how I'd followed a step-by-step guide to create a Amazon Alexa Skill for my Amazon Echo Dot.  This used Node.js and was basically an easy "join-the-dots" guide to creating your first skill and getting it certified.

Building on this I wanted to build a skill that:

  1. Uses Python - my language of choice.
  2. Calls an API (rather than just responding with pre-canned data).
  3. Teaches me more about how to configure skills to do different things.

Here's the skill in action.  I'll then describe how I made it:


To start with I used the Amazon Python "Colour Expert" skill which can be found here.  Follow this if it's your first time with an Alexa skill as it will show you how to use the Amazon Developer site and Amazon Web Services Lambda to create a skill using Python.

My idea was to modify this skill to fetch and read out data from my Strava (exercise logging) account.  I've previously blogged on using the Strava API in posts like this and this.

To modify the Colour Expert skill I initially did the following on the Amazon Developer site on the "Skill Information" tab:

  • Name = "Sports Geek Stuff".  This is just what you'd see on the Alexa smartphone app if you published the skill.
  • Invocation name = "sports geek".  This is what say to Alexa to specify you're using a particular skill.  So you'd start by saying "Alexa, ask sports geek" then subsequent words define what you want the skill to do.

I then added extra configuration on the "Interaction Model" tab to define how I should interact with the skill to get the Strava data.

The "Intent Schema" basically creates a structure that maps things you say to Alexa to the associated functions that you run in the AWS Lambda Python script (more on this below).  I added the following to the bottom of the Intent Schema.

    {
      "intent": "StravaStatsIntent"
    } 

I then defined an utterance (so basically a thing you say) that links to this intent.  The utterance was:

StravaStatsIntent for strava stats

...which basically means, when you say "Alexa, ask sports geek for strava stats" then Alexa calls the associated Python script in AWS Lambda with the parameter "StravaStatsIntent" to define what function to call.

Apart from ace voice to text translation, there's very little intelligence here.  You could configure:

StravaStatsIntent for a badger's sticker collection

...or even...

StravaStatsIntent for brexit means brexit

...and these crazy sayings would still result in the StravaStatsIntent being selected.

You also configure the Alexa skill to map to a single AWS Lambda function which will handle all the intents you configure.  So in simple terms a invocation name selects a Alexa skill which is linked to an AWS Lambda function.  Then utterances are configured that link to intents, each of which is handled by the Lambda function.

Here's a simple diagram of how it all  hangs together:


So next you have to edit the Python Lambda function to handle the intents.  I left the colour expert
skill as is and just added code for my Strava intent.  There is some other interesting aspects of the Python script that I'll explore later (these are slots and session handling) so I didn't want to remove this.

To modify the code I went to AWS, logged in, selected Lambda and chose to edit the code inline.  This gave me a screen like this that I could use to edit the Python script:


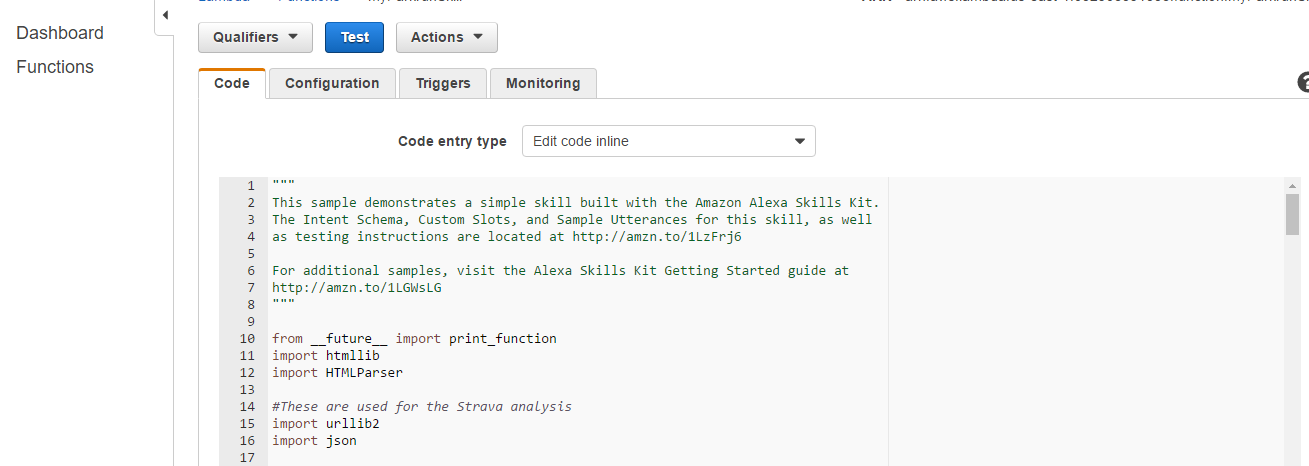
To modify the code I firstly added references to the Python urllib2 and json modules as I need to use these, (you can see them in the image above).

I also added my Strava developer API key and a Unix timestamp to use for the API call as constants.

I then edited the on_intent function to specify that the StravaStatsIntent would be passed.  This is shown in red below.

    # Dispatch to your skill's intent handlers
    if intent_name == "MyColorIsIntent":
        return set_color_in_session(intent, session)
    elif intent_name == "WhatsMyColorIntent":
        return get_color_from_session(intent, session)
    elif intent_name == "AMAZON.HelpIntent":
        return get_welcome_response()
    elif intent_name == "AMAZON.CancelIntent" or intent_name == "AMAZON.StopIntent":
        return handle_session_end_request()
    elif intent_name == "StravaStatsIntent":
        return handle_strava()    
    else:
        raise ValueError("Invalid intent")

I then created the handle_strava() function, all of which is shown below.  Yes, I know my code is clunky!

Key points here are:
  • Making the API call using urllib2 and getting a response
  • Parsing the JSON and building an output string
  • Not using  reprompt_text which could be used to prompt the user again as to what to say
  • Setting should_end_session to true as we don't want the session to continue beyond this point
  • Calling the build_response function to actually build the response to pass back to the Alexa skill


#Get us some Strava stats
def handle_strava():
    """ If we wanted to initialize the session to have some attributes we could
    add those here
    """

    session_attributes = {}
    card_title = "parkrun"
    
    #Access the Strava API using a URL
    StravaText = urllib2.urlopen('https://www.strava.com/api/v3/activities?access_token=' + StravaToken + '&per_page=200&after=' + TheUnixTime).read()
    
    #Parse the output to get all the information.  Set up some variables
    SwimCount = 0
    SwimDistance = 0
    RunCount = 0
    RunDistance = 0
    BikeCount = 0
    BikeDistance = 0

    #See how many Stravas there are.Count the word 'name', there's one per record
    RecCount = StravaText.count('name')

    #Load the string as a JSON to parse
    StravaJSON = json.loads(StravaText)

    #Loop through each one
    for i in range(0,RecCount):
      #See what type it was and process accordingly
      if (StravaJSON[i]['type'] == 'Swim'):
        SwimCount = SwimCount + 1
        SwimDistance = SwimDistance + StravaJSON[i]['distance']
      elif (StravaJSON[i]['type'] == 'Ride'):
        BikeCount = BikeCount + 1
        BikeDistance = BikeDistance + StravaJSON[i]['distance']
      elif (StravaJSON[i]['type'] == 'Run'):
        RunCount = RunCount + 1
        RunDistance = RunDistance + StravaJSON[i]['distance']
    
    #Turn distances into km
    SwimDistance = int(SwimDistance / 1000)
    BikeDistance = int(BikeDistance / 1000)
    RunDistance = int(RunDistance / 1000)
    
    #Build the speech output
    speech_output = 'Swim Count = ' + str(SwimCount) + '. Swim Distance = ' + str(SwimDistance) + " kilometres.  "
    speech_output = speech_output + 'Bike Count = ' + str(BikeCount) + '. Bike Distance = ' + str(BikeDistance) + " kilometres.  "
    speech_output = speech_output + 'Run Count = ' + str(RunCount) + '. Run Distance = ' + str(RunDistance) + " kilometres."
    
    # If the user either does not reply to the welcome message or says something
    # that is not understood, they will be prompted again with this text.
    # Now we set re-prompt text to None.  See notes elsewhere for what this means
    #reprompt_text = "Please tell me your favorite color by saying, " \
    #                "my favorite color is red."
    #This could be set to false of you want the session to continue
    should_end_session = True
    reprompt_text = None

    return build_response(session_attributes, build_speechlet_response(
        card_title, speech_output, reprompt_text, should_end_session))


You can test if you have a Amazon Echo device or just test using the Alexa Skills Kit test capability.


Saturday, 29 October 2016

Resting Heart Rate and Fitness

Previously I've done plenty of posts on using Fitbit Heart Rate data, Strava data and suchlike to assess my fitness.

Two things I've spotted recently:

  1. My resting heart rate seems to be decreasing, as shown on my Fitbit Charge HR.
  2. I seem to be running consistently faster at parkrun.

Conventional wisdom is that a lower heart rate represents improved fitness.  So to find out whether the two are linked...

The analysis was pretty simple.  First I just scraped monthly average resting heart rate data from my Fitbit app and noted it in Excel (I didn't think I'd need the power or R for this analysis).  This nicely smooths out day-to-day variations in heart rate and shows some decent trends.  Example:


I also scraped all parkrun results from the parkrun website.  I chose to use parkrun for this analysis as it's the same distance run at the same time every week in (almost) the same place.  There are some variables that could affect my time (e.g. if it's muddy underfoot, the odd bit of tourism) but these things should cancel themselves out if you take enough data points and allow trends to be spotted.  An example of the data:

With some Excel jiggery-pokery I managed to get resting heart rate (blue line) and park run times (orange dots) on the same chart.  Here it is:


I like this chart as it tells a real story of the correlation between heart rate and fitness (or low parkrun time).

  • On the left hand side you can see when I first got my Fitbit, my resting heart rate was between 65 and 70 BPM and my parkrun time was ~21 minutes.  
  • I then got injured in summer 2015 and there was a gap when I didn't run at all.  At the end of this my resting heart rate was over 70 BPM so I was relatively unfit.
  • I then made a comeback in Autumn 2015, started running regularly and by Spring 2016 had a sub 60 resting heart rate and was running sub 20 minute parkruns.
  • Then the summer 2016 came and for various reasons (holidays, kids' activities, doing cycling) and my heart rate crept up to nearly 60 BPM and my parkrun time went back to the ~21 minute realm.
  • Then most recently I've done a strong block of focused running training, my heart rate is at 55 BPM (lowest ever recorded) and I'm back to 20 minute and sub 20 minute parkruns.

I love graphs like this!  My view is that running is an "honest" sport, the more you put in the more you get out, and this graph underlines this point.


Sunday, 17 April 2016

Strava and Fitbit API Mash-up Using Raspberry Pi and Python

Previously I blogged on how I used data from the Fitbit API to look at cadence information gathered during runs I'd logged on Strava.

Now that was all very good and informative but:
  • I analysed the Strava results manually.  i.e. Stepped through the website and noted down dates, times and durations of runs.
  • I used the Fitbit OAUTH1.0 URL builder website.  Very manual and using OAUTH1.0, (since deprecated, see here on using OAUTH2.0).
...so it  was time to automate the process and upgrade to OAUTH2.0!  Hence it was time to break out the Raspberry Pi and get coding.

Full code at the bottom of this post (to not interrupt the flow) but the algorithm is as follows:
  • Loop, pulling back activity data from the Strava API (method here).
  • Select each Strava run (i.e. filter out rides and swims) and log key details (start date/time, duration, name, distance)
  • Double check if the date of the run was after I got my Fitbit (the FitbitEpoch constant).  If it is, form the Fitbit API URL using date and time parameters derived from the Strava API output.
  • Call the Fitbit API using the OAUTH2.0 method.
  • Log the results for later processing.
...easy (the trickiest bit was date/time manipulation)!

This provides output like this:
pi@raspberrypi:~/Exercise/logs $ head steps_log_1.txt
2016-04-16T09:02:03Z_4899.7,Parkrun 20160416,1,09:02:00,100
2016-04-16T09:02:03Z_4899.7,Parkrun 20160416,2,09:03:00,169
2016-04-16T09:02:03Z_4899.7,Parkrun 20160416,3,09:04:00,170
2016-04-16T09:02:03Z_4899.7,Parkrun 20160416,4,09:05:00,171
2016-04-16T09:02:03Z_4899.7,Parkrun 20160416,5,09:06:00,172
2016-04-16T09:02:03Z_4899.7,Parkrun 20160416,6,09:07:00,170
2016-04-16T09:02:03Z_4899.7,Parkrun 20160416,7,09:08:00,170
2016-04-16T09:02:03Z_4899.7,Parkrun 20160416,8,09:09:00,170
2016-04-16T09:02:03Z_4899.7,Parkrun 20160416,9,09:10:00,168
2016-04-16T09:02:03Z_4899.7,Parkrun 20160416,10,09:11:00,170

So a date and time,name of the run, minute of run and step count.

So easy to filter out interesting runs to compare:
pi@raspberrypi:~/Exercise/logs $ grep 20150516 steps_log_1.txt > parkrun_steps_1.txt
pi@raspberrypi:~/Exercise/logs $ grep 20160416 steps_log_1.txt >> parkrun_steps_1.txt

Then import to R for post analysis and plotting:
> parkrun1 <- read.csv(file=file.choose(),head=FALSE,sep=",")

> colnames(parkrun1) <- c("DateTimeDist","Name","Minute","TimeOfDay","Steps") 
> head(parkrun1)
                 DateTimeDist                              Name Minute TimeOfDay Steps
1 2015-05-16T09:00:00Z_5000.0 Naked Winchester Parkrun 20150516      1  09:00:00    85
2 2015-05-16T09:00:00Z_5000.0 Naked Winchester Parkrun 20150516      2  09:01:00   105
3 2015-05-16T09:00:00Z_5000.0 Naked Winchester Parkrun 20150516      3  09:02:00   107
4 2015-05-16T09:00:00Z_5000.0 Naked Winchester Parkrun 20150516      4  09:03:00   136
5 2015-05-16T09:00:00Z_5000.0 Naked Winchester Parkrun 20150516      5  09:04:00   162
6 2015-05-16T09:00:00Z_5000.0 Naked Winchester Parkrun 20150516      6  09:05:00   168

library(ggplot2)
> ggplot(data = parkrun1, aes(x = Minute, y = Steps, color = Name)) 
+ geom_point() + geom_line() 
+ labs(x="Minute", y="Steps") + ggtitle("Running Cadence - Parkrun") 

Yielding this graph:

Interesting that I took longer to get going on the 2015 run, maybe there was congestion at the start.  The key thing I was looking for was the "steady state" cadence comparison between 2015 and 2016.  It's higher in 2016 which is exactly what I wanted to see as it's something I've worked on improving.

Using the same method I plotted the chart below which shows a long run prior to a half-marathon then the half-marathon itself:


Now this is interesting. The cadence was slightly higher for the whole of the training run (blue line) and much more consistent.  For the half-marathon itself (red line) my cadence really tailed off which is in tune with my last post where I analysed my drop off in speed over the final quarter of the run.

Here's all the code.  Modify for your API credentials, file system and Fitbit "Epoch" accordingly:

pi@raspberrypi:~/Exercise $ more strava_fitbit_v1.py
#here's a typical Fitbit API URL
#FitbitURL = "https://api.fitbit.com/1/user/-/activities/steps/date/2016-01-31/1d/1min/time/09:00/09:15.json"

import urllib2
import base64
import json
from datetime import datetime, timedelta
import time
import urllib
import sys
import os

#The base URL we use for activities
BaseURLActivities = "https://www.strava.com/api/v3/activities?access_token=<Strava_Token_Here>per_page=200&page="
StepsLogFile = "/home/pi/Exercise/logs/steps_log_1.txt"

#Start element of Fitbit URL
FitbitURLStart = "https://api.fitbit.com/1/user/-/activities/steps/date/"

#Other constants
MyFitbitEpoch = "2015-01-26"

#Use this URL to refresh the access token
TokenURL = "https://api.fitbit.com/oauth2/token"

#Get and write the tokens from here
IniFile = "/home/pi/Exercise/tokens.txt"

#From the developer site
OAuthTwoClientID = "FitBitClientIDHere"
ClientOrConsumerSecret = "FitbitSecretHere"

#Some contants defining API error handling responses
TokenRefreshedOK = "Token refreshed OK"
ErrorInAPI = "Error when making API call that I couldn't handle"

#Get the config from the config file.  This is the access and refresh tokens
def GetConfig():
  print "Reading from the config file"

  #Open the file
  FileObj = open(IniFile,'r')

  #Read first two lines - first is the access token, second is the refresh token
  AccToken = FileObj.readline()
  RefToken = FileObj.readline()

  #Close the file
  FileObj.close()

  #See if the strings have newline characters on the end.  If so, strip them
  if (AccToken.find("\n") > 0):
    AccToken = AccToken[:-1]
  if (RefToken.find("\n") > 0):
    RefToken = RefToken[:-1]

  #Return values
  return AccToken, RefToken

def WriteConfig(AccToken,RefToken):
  print "Writing new token to the config file"
  print "Writing this: " + AccToken + " and " + RefToken

  #Delete the old config file
  os.remove(IniFile)

  #Open and write to the file
  FileObj = open(IniFile,'w')
  FileObj.write(AccToken + "\n")
  FileObj.write(RefToken + "\n")
  FileObj.close()

#Make a HTTP POST to get a new
def GetNewAccessToken(RefToken):
  print "Getting a new access token"

  #RefToken = "e849e1545d8331308eb344ce27bc6b4fe1929d8f1f9f3a056c5636311ba49014"

  #Form the data payload
  BodyText = {'grant_type' : 'refresh_token',
              'refresh_token' : RefToken}
  #URL Encode it
  BodyURLEncoded = urllib.urlencode(BodyText)
  print "Using this as the body when getting access token >>" + BodyURLEncoded

  #Start the request
  tokenreq = urllib2.Request(TokenURL,BodyURLEncoded)
  #Add the headers, first we base64 encode the client id and client secret with a : inbetween and create the authorisation header
  tokenreq.add_header('Authorization', 'Basic ' + base64.b64encode(OAuthTwoClientID + ":" + ClientOrConsumerSecret))
  tokenreq.add_header('Content-Type', 'application/x-www-form-urlencoded')

  #Fire off the request
  try:
    tokenresponse = urllib2.urlopen(tokenreq)

    #See what we got back.  If it's this part of  the code it was OK
    FullResponse = tokenresponse.read()

    #Need to pick out the access token and write it to the config file.  Use a JSON manipluation module
    ResponseJSON = json.loads(FullResponse)

    #Read the access token as a string
    NewAccessToken = str(ResponseJSON['access_token'])
    NewRefreshToken = str(ResponseJSON['refresh_token'])
    #Write the access token to the ini file
    WriteConfig(NewAccessToken,NewRefreshToken)

    print "New access token output >>> " + FullResponse
  except urllib2.URLError as e:
    #Gettin to this part of the code means we got an error
    print "An error was raised when getting the access token.  Need to stop here"
    print e.code
    print e.read()
    sys.exit()

#This makes an API call.  It also catches errors and tries to deal with them
def MakeAPICall(InURL,AccToken,RefToken):
  #Start the request
  req = urllib2.Request(InURL)

  #Add the access token in the header
  req.add_header('Authorization', 'Bearer ' + AccToken)

  print "I used this access token " + AccToken
  #Fire off the request
  try:
    #Do the request
    response = urllib2.urlopen(req)
    #Read the response
    FullResponse = response.read()

    #Return values
    return True, FullResponse
  #Catch errors, e.g. A 401 error that signifies the need for a new access token
  except urllib2.URLError as e:
    print "Got this HTTP error: " + str(e.code)
    HTTPErrorMessage = e.read()
    print "This was in the HTTP error message: " + HTTPErrorMessage
    #See what the error was
    if (e.code == 401) and (HTTPErrorMessage.find("Access token invalid or expired") > 0):
      GetNewAccessToken(RefToken)
      return False, TokenRefreshedOK
    elif (e.code == 401) and (HTTPErrorMessage.find("Access token expired") > 0):
      GetNewAccessToken(RefToken)
      return False, TokenRefreshedOK
    #Return that this didn't work, allowing the calling function to handle it
    return False, ErrorInAPI


#This function takes a date and time and checks whether it's after a given date
def CheckAfterFitbit(InDateTime):
  #See how many days there's been between today and my first Fitbit date.
  StravaDate = datetime.strptime(InDateTime,"%Y-%m-%dT%H:%M:%SZ")    #First Fitbit date as a Python date object
  FitbitDate = datetime.strptime(MyFitbitEpoch,"%Y-%m-%d")                   #Last Fitbit date as a Python date object

  #See if the provided date is greater than the Fitbit date.  If so, return True, else return  false
  if ((StravaDate - FitbitDate).days > -1):
    return True
  else:
    return False

#Forms the full URL to use for Fitbit.  Example:
#https://api.fitbit.com/1/user/-/activities/steps/date/2016-01-31/1d/1min/time/09:00/09:15.json
def FormFitbitURL(URLSt,DtTmSt,Dur):
  #First we need to add the date component which should be the first part of the date and time string we got from Strava.  Add the next few static bits as well
  FinalURL = URLSt + DtTmSt[0:10] + "/1d/1min/time/"

  #Now add the first time part which is also provided as a parameter. This will take us back to the start of the minute STrava started which is what we want
  FinalURL = FinalURL + DtTmSt[11:16] + "/"

  #Now we need to compute the end time which needs a bit of maths as we need to turn the start date into a Python date object and then add on elapsed seconds,
  #turn back to a string and take the time part
  StravaStartDateTime = datetime.strptime(DtTmSt,"%Y-%m-%dT%H:%M:%SZ")

  #Now add elapsed time using time delta function
  StravaEndDateTime = StravaStartDateTime + timedelta(seconds=int(Dur))
  EndTimeStr = str(StravaEndDateTime.time())

  #Form the final URL
  FinalURL = FinalURL + EndTimeStr[0:5] + ".json"
  return FinalURL


#@@@@@@@@@@@@@@@@@@@@@@@@@@@This is the main part of the code
#Open the file to use
MyFile = open(StepsLogFile,'w')

#Loop extracting data.  Remember it comes in pages.  Initialise variables first, including the tokens to use
EndFound = False
LoopVar = 1
AccessToken = ""
RefreshToken = ""

#Get the tokens from the config file
AccessToken, RefreshToken = GetConfig()

#Main loop - Getting all activities
while (EndFound == False):
  #Do a HTTP Get - First form the full URL
  ActivityURL = BaseURLActivities + str(LoopVar)
  StravaJSONData = urllib2.urlopen(ActivityURL).read()

  if StravaJSONData != "[]":   #This checks whether we got an empty JSON response and so should end
    #Now we process the JSON
    ActivityJSON = json.loads(StravaJSONData)

    #Loop through the JSON structure
    for JSONActivityDoc in ActivityJSON:
      #See if it was a run.  If so we're interested!!
      if (str(JSONActivityDoc["type"]) == "Run"):
        #We want to grab a date, a start time and a duration for the Fitbit API.  We also want to grab a distance which we'll use as a grpah legend
        print "@@@@@@@@@@@@@@@@@@@@@@@@@@@@@@@@@@@@@@@@@@@@@@@@@@@@@@@@@@@@@@@@@@@@@@@@@@@@@@@@@@@@@@@@@"
        StartDateTime = str(JSONActivityDoc["start_date_local"])
        StravaDuration = str(JSONActivityDoc["elapsed_time"])
        StravaDistance = str(JSONActivityDoc["distance"])

        StravaName = str(JSONActivityDoc["name"])

        #See if it's after 2015-01-26 which is when I got my Fitbit
        if CheckAfterFitbit(StartDateTime):
          #Tell the user what we're doing
          print "Strava Date and Time: " +  StartDateTime
          print "Strava Duration: " + StravaDuration
          print "Strava Distance: " + StravaDistance

          #Form the URL to use for Fitbit
          FitbitURL = FormFitbitURL(FitbitURLStart,StartDateTime,StravaDuration)
          print "Am going to call FitbitAPI with: " + FitbitURL

          #Make the API call
          APICallOK, APIResponse = MakeAPICall(FitbitURL, AccessToken, RefreshToken)
          #See how this came back.
          if not APICallOK:    #An error in the response.  If we refreshed tokens we go again.  Else we exit baby!
            if (APIResponse == TokenRefreshedOK):
              #Just make the call again
              APICallOK, APIResponse = MakeAPICall(FitbitURL, AccessToken, RefreshToken)
            else:
              print "An error occurred when I made the Fitbit API call.  Going to have to exit"
              sys.exit(0)

          #If we got to this point then we must have got an OK response.  We need to process this into the text file.  Format is:
          #Date_Distance,MinuteWithinRun,Time,Steps
          #print APIResponse
          ResponseAsJSON = json.loads(APIResponse)
          MinNum = 1    #Use this to keep track of the minute within the run, incrementing each time
          for StepsJSON in ResponseAsJSON["activities-steps-intraday"]["dataset"]:
            OutString = StartDateTime + "_" + StravaDistance + "," + StravaName + "," + str(MinNum) + "," + str(StepsJSON["time"]) + "," + str(StepsJSON["value"]) + "\r\n"
            #Write to file
            MyFile.write(OutString)
            #Increment the loop var
            MinNum += 1

    #Set up for next loop
    LoopVar += 1
  else:
    EndFound = True

#Close the log file
MyFile.close()

Tuesday, 15 March 2016

Strava API Lap Analysis Using Raspberry Pi, Python and R

I'm training for a Half Marathon at the moment and, without meaning to sound too full of myself, I think I'm getting fitter.  This seems to be born out by my resting heart rating as measured by my Fitbit Charge HR which, after my previous analysis, continues to get lower:


When out for a long run on Saturday it struck me that, for the same perceived effort, it feels like I'm getting faster in terms of how long each kilometer takes me to run.  As Greg Lemond once said "it doesn't get any easier, you just go faster".  Hence, when running, I formed a plan to look at the pace stats from my ~2 years worth of Garmin gathered Strava data to see how my pace is changing.

For a previous post I described how to get Strava activity data from the Strava API.  After registering for a key, a HTTP GET to an example URL such as:

https://www.strava.com/api/v3/activities?access_token=<YourKey>&per_page=200&page=1

...returns a bunch of JSON documents, each of which describes a Strava activity and each of which has a unique ID.  Then, as described in this post, you can get "lap" data for a particular activity with a HTTP GET to a URL like this:

https://www.strava.com/api/v3/activities/<ActvityID>/laps?access_token=<YourKey>

So what is a "lap"?  In  it's simplest form, you get a lap logged every time you press "Lap" on your stopwatch.  So for an old skool runner, every time you pass a km or mile marker in a race you pressed lap and looked at your watch to see if you were running at your target pace.

These days a modern smartwatch will log every lap for post-analysis and can also be set up to auto-lap on time or distance.  For the vast majority of my runs I have my watch configured to auto-lap every km so I have a large set of data ready-available to me!

As all good data is, there is also some messiness in it; specifically for some runs where I've chosen to manually log laps, have had the lap function turned off (so the whole run is a single lap) or have a small sub-km distance at the end of the run that is logged as a lap.

So to analyse the data.  I chose to write a Python script on my Raspberry Pi 2 that would:
  • Extract activity data from the Strava API.  It has a limit of 200 activities per page so I had so request multiple pages.
  • Then for each activity, if it was a run, extract lap data from the Strava API.
  • Then log all the lap data, taking into account any anomalies (specifically missing heart rate data), into a file for further analysis.
Here's all the code.  The comments should describe what's going on:

import urllib2
import json

#The base URL we use for activities
EndURLLaps = "/laps?access_token=<YourKey>"
LapLogFile = "/home/pi/Strava/lap_log_1.txt"

#Open the file to use
MyFile = open(LapLogFile,'w')

#Loop extracting data.  Remember it comes in pages
EndFound = False
LoopVar = 1

#Main loop - Getting all activities
while (EndFound == False):
  #Do a HTTP Get - First form the full URL
  ActivityURL = BaseURLActivities + str(LoopVar)
  StravaJSONData = urllib2.urlopen(ActivityURL).read()
  
  if StravaJSONData != "[]":   #This checks whether we got an empty JSON response and so should end
    #Now we process the JSON
    ActivityJSON = json.loads(StravaJSONData)

    #Loop through the JSON structure
    for JSONActivityDoc in ActivityJSON:
      #Start forming the string that we'll use for output
      OutStringStem = str(JSONActivityDoc["start_date"]) + "|" + str(JSONActivityDoc["type"]) + "|" + str(JSONActivityDoc["name"]) + "|" + str(JSONActivityDoc["id"]) + "|"
      #See if it was a run.  If so we're interested!!
      if (str(JSONActivityDoc["type"]) == "Run"):
        #Now form a URL and get the laps for this activity and get the JSON data
        LapURL = StartURLLaps + str(JSONActivityDoc["id"]) + EndURLLaps
        LapJSONData = urllib2.urlopen(LapURL).read()

        #Load the JSON to process it
        LapsJSON = json.loads(LapJSONData)

        #Loop through the lap, checking and logging data
        for MyLap in LapsJSON:
          OutString = OutStringStem + str(MyLap["lap_index"]) + "|" + str(MyLap["start_date_local"]) + "|" + str(MyLap["elapsed_time"]) + "|" 
          OutString = OutString + str(MyLap["moving_time"]) + "|" + str(MyLap["distance"]) + "|" + str(MyLap["total_elevation_gain"]) + "|"
          
          #Be careful with heart rate data, might not be  there if I didn't wear a strap!!!
          if "average_heartrate" not in MyLap:
            OutString = OutString + "-1|-1\n"
          else:
            OutString = OutString + str(MyLap["average_heartrate"]) + "|" + str(MyLap["max_heartrate"]) + "\n"
          
          #Print to screen and write to file
          print OutString
          MyFile.write(OutString)          
    #Set up for next loop
    LoopVar += 1
  else:
    EndFound = True

#Close the log file
MyFile.close()

So this created a log file that looked like this:

pi@raspberrypi:~/Strava $ tail lap_log_1.txt
2014-06-30T05:39:36Z|Run|Copenhagen Canter|160234567|8|2014-06-30T08:18:12Z|283|278|1000.0|6.3|-1|-1
2014-06-30T05:39:36Z|Run|Copenhagen Canter|160234567|9|2014-06-30T08:22:52Z|272|271|1000.0|16.2|-1|-1
2014-06-30T05:39:36Z|Run|Copenhagen Canter|160234567|10|2014-06-30T08:27:29Z|295|280|1000.0|18.1|-1|-1
2014-06-30T05:39:36Z|Run|Copenhagen Canter|160234567|11|2014-06-30T08:34:27Z|58|54|195.82|0.0|-1|-1
2014-06-26T11:16:34Z|Run|Smelsmore Loop|158234567|1|2014-06-26T12:16:34Z|2561|2561|8699.8|80.0|-1|-1
2014-06-20T11:09:00Z|Run|Smelsmore Loop|155234567|1|2014-06-20T12:09:00Z|2529|2484|8015.3|80.1|-1|-1
2014-06-16T16:23:19Z|Run|HQ to VW.  Strava was naughty and only caught part of it|154234567|1|2014-06-16T17:23:19Z|640|640|2169.9|39.2|-1|-1
2014-06-10T11:13:31Z|Run|Sunny squelchy Smelsmore|151234567|1|2014-06-10T12:13:31Z|2439|2429|8235.2|83.4|-1|-1
2014-06-03T10:57:58Z|Run|Lost in Donnington|148234567|1|2014-06-03T11:57:58Z|1933|1874|6266.7|86.0|-1|-1
2014-05-24T07:43:52Z|Run|Calf rehab run|144234567|1|2014-05-24T08:43:52Z|2992|2964|9977.4|170.7|-1|-1

Time to analyse the data in R!

First import the data into a data frame:
> StravaLaps1 <- read.csv(file="/home/pi/Strava/lap_log_1.txt",head=FALSE,sep="|")

Add some meaningful column names:
> colnames(StravaLaps1) <- c("ActvityStartDate","Type","Name","ActivityID","LapIndex","LapStartDate","ElapsedTime","MovingTime","Distance","ElevationGain","AveHeart","MaxHeart")

Turn the distance and time values to numbers so we can do some maths on them:
> StravaLaps1$ElapsedTimeNum = as.numeric(StravaLaps1$ElapsedTime)
> StravaLaps1$DistanceNum = as.numeric(StravaLaps1$Distance)

Now calculate the per km pace.  For the laps which were derived from the "auto-lap at 1 km" settings this just means we're dividing the elapsed time for the lap by 1.  Otherwise it scales up (for <1km laps) or down (for >1km laps) as required.
> StravaLaps1$PerKmLapTime <- StravaLaps1$ElapsedTimeNum / (StravaLaps1$DistanceNum / 1000)

 The data comes off the Strava API in reverse chronological order.  Hence to make sure it can be ordered for graphing I need to create a Posix time column, i.e. a column that's interpreted as a date and time, not just text.  To do this I first re-format the date and time using strptime, then turn into Posix.

> StravaLaps1$LapStartDateSimple <- strptime(StravaLaps1$LapStartDate, '%Y-%m-%dT%H:%M:%SZ')
> StravaLaps1$LapStartDatePosix <- as.POSIXlt(StravaLaps1$LapStartDateSimple)

...which gives us data like this:

> head(StravaLaps1[,c(13,14,15,17)])
  MovingTimeNum DistanceNum PerKmLapTime   LapStartDatePosix
1           269        1000          268 2016-03-12 08:55:11
2           263        1000          266 2016-03-12 08:59:44
3           264        1000          267 2016-03-12 09:04:10
4           258        1000          259 2016-03-12 09:08:37
5           271        1000          272 2016-03-12 09:12:56
6           252        1000          255 2016-03-12 09:17:30

Now to draw a lovely graph using ggplot2:
>library(ggplot2)
> qplot(LapStartDatePosix,PerKmLapTime,data=StravaLaps1,geom=c("point","smooth"),ylim=c(200,600),xlab="Date",ylab="KM Pace(s)",main="KM Pace from Strava")


Which gives this:


Now that is an interesting graph!  Each "vertical line" represents a single run with each point being a lap for that run.  A lot of the recent points are between 250 seconds (so 4m10s per km) and 300s (so 5m per km) which is about right.

On the graph you can also see a nice even spread of runs from spring 2014 to early summer 2015.  There was then a gap when I was injured until Sep 2015 when I returned from injury and then Dec 2015 when I started training in earnest.

The regression line is interesting, reaching it's min point by Autumn 2015 (when I started doing short, fast 5km runs at ~4m10s per km) and then starting to increase again as my distance increased (to ~4m30s per km).

So it was interesting to just look at the most recent data. To find the start point I scanned back in the data to the point I started running again after my injury.  This was derived by doing the following command to just extract the first rows of the data frame into a new data frame:
>StravaLaps2 <- StravaLaps1[c(1:423),]

> tail(StravaLaps2[,c(1,3)])
        ActvityStartDate          Name
418 2015-11-10T07:54:51Z   Morning Run
419 2015-11-10T07:54:51Z   Morning Run
420 2015-11-10T07:54:51Z   Morning Run
421 2015-11-05T07:51:20Z Cheeky HQ Run
422 2015-11-05T07:51:20Z Cheeky HQ Run
423 2015-11-05T07:51:20Z Cheeky HQ Run

Where "Cheeky HQ Run" was a short tentative run I did as the first of my "comeback".  A plot using this data and a regression line is shown below:

> qplot(LapStartDatePosix,PerKmLapTime,data=StravaLaps2,geom=c("point","smooth"),ylim=c(200,600),xlab="Date",ylab="KM Pace(s)",main="KM Pace from Strava - Recent")


Now I REALLY like this graph.  Especially as the regression line shows I am getting faster which was the answer I wanted!  However with a bit less data you can see each run in more detail (each vertical line) and an interesting pattern emerges.

Best to look at this by delving into the data even more and just taking Feb and March data:

> StravaLaps3 <- StravaLaps2[c(1:201),]

> qplot(LapStartDatePosix,PerKmLapTime,data=StravaLaps3,geom=c("point","smooth"),ylim=c(200,600),xlab="Date",ylab="KM Pace(s)",main="KM Pace from Strava - Feb/Mar 2016")


Taking the run (vertical set of points) on the far right and moving left we see:

  • Long 21k run at a consistent pace so lots of points clustered together.
  • Shorter hillier run so less points and similar pace.
  • Intervals session so some very fast laps (sub 4 min km) and some slow jogging
  • Long 18k run at a consistent pace but not so nicely packed together as the 21k run

...and so on back in time with each type of run (long, short and intervals) having it's own telltale "finger print".  For example the second run from the right is a 5k fast (for me) Parkrun so has a small number of laps at a pretty good (for me) pace.

Overall I really like this data and what Strava, Raspberry Pi, Python and R lets me do with it.  First of all it tells me I'm getting faster which is always good.  Second it has an interesting pattern and each type of run is easily distinguishable which is nice.  Finally it's MY data; I'm playing with and learning about this stuff with my own data which is somehow more fun than using pre-prepared sample data.