Showing posts with label php. Show all posts

Saturday, 10 January 2015

Raspberry Pi and Strava API #3

In a previous post I described how I've used the Strava API to analyse the results from my High Intensity Interval Training (HIIT) sessions.  I use PHP on a Raspberry Pi webserver to extract, organise and present Strava data.  It's a few weeks on so it's time to see how I'm getting on.

Here's a new chart showing up to date results:


The previous set of results were up to and included 1014-11-27 so the last seven results are new over and above last time.  So what can I tell from this:

  • I'm a lot more consistent.  There's less "spread" between the fastest and slowest interval.
  • I'm pedaling faster, there's a general upwards trend.

To double check whether the my cadence is getting higher, I've calculated an average of averages (I know this is a little imprecise) which is plotted below:


...so no doubt about this, I'm definitely pedaling faster now.  The reason for this is that I'm now watching my cadence as I do the fast intervals.  I do this simply by strapping my sports watch to the handle bars on my bike! I have a target of 130 RPM so just try and keep my cadence on or above that.

But am I getting any fitter?  To look at this I've also plotted the maximum heart rate logged by my sports watch over the course of the HIIT session.  My theory is that as I get fitter I should be able to achieve the same average cadence for a lower heart rate.  Here's how the chart looks:


To me, this just shows I'm working harder because as my average cadence has gone up, so has my maximum heart rate (notwithstanding the last heart rate point which may just be an anomaly).

Next step: More HIIT sessions, more consistent 130 RPM sessions and (hopefully) a lower heart rate...

So add extra colour I thought I'd include a few pictures the"shed of mild discomfort" where I do my training.  As you can see it's a very high tech, snazzy environment.  I'm sure all the Top Pros from Team Sky and Saxo Tinkoff train in environments like this...

View from the outside, not cluttered at all:


View from the saddle.  always nice to have spiders to keep you company when you're training...


Close up of the clutter.  Just enough room to train in, the turbo moves on the wooden floor if I bump about too much!  Occasionally things drop off the shelves and twice I've shifted backwards and the when has rubbed hard against the chest of drawers, creating a lovely burning rubber aroma...


Monday, 1 December 2014

Raspberry Pi and Strava API #2

In a previous post blogged on how I've managed to cross the streams of two of my hobbies, geekery and exercise, using my Raspberry Pi and the Strava API.  I've extended this by creating a capability to use Strava API data to see if I am getting fitter through exercise activities.

One key part of this is having an exercise regime that is repeatable in a controlled fashion to allow the likes of me, who lacks an exercise lab, to do some analysis.  With half a mind on the geek potential it provided, back in September I started to do HIIT sessions using the same bike setup and the same exercise protocol.

Now generally I am skeptical of exercise fads but HIIT:
  • Seemed to have a number of reputable scientific studies backing it.
  • Enabled me to fit in sessions in very short time windows.
  • Is very basic, no HIIT specific equipment provided so no one trying to sell you kit or DVDs or exercise programmes.
So my bike is setup on a turbo trainer and I always have it in the same gear and on the same turbo resistance setting.  I know that things like tyre pressure could vary (thus changing rolling resistance) but by and large the conditions are similar.

I have a heart rate monitor and speed/cadence sensor on my bike so I can log these things as I exercise.  I don't have a fancy-dan power meter.

My exercise regime is as follows:
  • 4 minute warm up
  • 6 lots of flat out for 20 seconds followed by 10 seconds rest.
  • 3 minute warm down.
...so all done in 10 minutes flat.

So in Strava I get these sort of results:


So you can see my speed and cadence peak for every interval and my heart rate increase gently during the warm-up, goes up quickly (in steps) during the flat-out periods and then drops during the warm-down.

So all good stuff but as a geek I need to know whether the results above are any better than this other session below:


Looks like a better first couple of reps but tailed off at the end.  The Strava UI didn't seem to give me a good way to compare and contrast my ~20 HIIT sessions so I decided to find a geeky way!  A quick look at the Strava API documentation showed that there is a "laps" resource in the API so I decided to use it as my Garmin logs each section of the HIIT activity as a lap.

First you identify the Strava activity in question by listing all activities:

https://www.strava.com/api/v3/activities?access_token=<your token here>&per_page=200

You then list the laps for a specific activity using this URL:

https://www.strava.com/api/v3/activities/331779633/laps?access_token=<your token here>&per_page=200

Which gives you easily parsable json output like this (just 2 laps shown for clarity):

[{"id":744754123,"resource_state":2,"name":"Lap 1","activity":{"id":331779633},"athlete":{"id":4309532},"elapsed_time":240,"moving_time":241,"start_date":"2014-11-18T19:49:59Z","start_date_local":"2014-11-18T19:49:59Z","distance":1527.27,"start_index":0,"end_index":36,"total_elevation_gain":0.0,"average_speed":6.4,"max_speed":6.7,"average_cadence":69.1,"average_watts":70.7,"average_heartrate":85.2,"max_heartrate":116.0,"lap_index":1},{"id":744744535,"resource_state":2,"name":"Lap 2","activity":{"id":220668522},"athlete":{"id":4309532},"elapsed_time":20,"moving_time":19,"start_date":"2014-11-18T19:54:04Z","start_date_local":"2014-11-18T19:54:04Z","distance":245.38,"start_index":37,"end_index":45,"total_elevation_gain":0.0,"average_speed":12.3,"max_speed":12.4,"average_cadence":124.5,"average_watts":320.2,"average_heartrate":134.8,"max_heartrate":148.0,"lap_index":2}

So for each lap you get a range of interesting information such as:
  • average_cadence
  • average_watts (which I assume to be estimated as I don't have a power meter)
  • average_heartrate
  • max_heartrate
So for every HIIT session I've done I've given it a name in Strava using the format "HIIT YYYYMMDD" so it was easy to write some PHP to:

  • List all activities and put the resulting json into an array.
  • Loop through the array and pick out each of the HIIT activities.
  • For each HIIT session, call the API to get lap resource information.
  • Parse the json to pick out measurements for each lap.
  • Print the results into a web page.

Full code listing is at the bottom of this blog post.  The output I get within a browser window is shown below:


So a very raw CSV print out of 3 key metrics per lap.  So I could easily take this CSV data and pull it into Excel for data analysis.  For example I could put together this graph showing average cadence per lap:


So laps 2,4,6,8,10 and 12 are the laps where I put in a lot of effort for 20 seconds.  (Lap 1 is warm up, lap 13 is the final 10 seconds after a hard effort 6 and lap 14 is warm down).

I first put this graph together a couple of weeks ago and one initial observation was that in previous HIIT sessions that was a lot of variance, both within a session and from session to session. This was because I had no real targets for hard efforts, I just did it as hard as I could and held on for the last couple of efforts.  Hence in the last two weeks I've focussed on doing "tighter" sessions where the target is 130rpm across all the efforts. You can see this on the graph where there's much less of a spread from lap 2 to lap 12 and they're clustered in the 120 to 135 range.

Next: More HIIT sessions, more analysis and attempting to draw graphs on web page rather than nasty old Excel.

Full code (remember I'm new to PHP):

<!DOCTYPE html>
<html>
  <head>
    <meta charset="UTF-8">
    <title>Weeks Family Strava Fun</title>
    <link rel="stylesheet" type="text/css" href="/stylesheet/style1.css">
  </head>
  <body>
   <!-- Get the value from Strava-->
   <?php
     //Use cURL to get the value from Strava.  Max 200 actvities per file.  After that will need to play with pages...
     $curl = curl_init();
     curl_setopt ($curl, CURLOPT_URL, "https://www.strava.com/api/v3/activities?access_token=<your token here>&per_page=200");
     curl_setopt($curl, CURLOPT_RETURNTRANSFER, 1);
     $result = curl_exec ($curl);
     curl_close ($curl);
     $json_a=json_decode($result,true);
     //Good debug code
     //foreach($json_a as $num)
     //{
     //print $num[start_date]."-".$num[name]."-".$num[type]."-".$num[distance]."-".$num[total_elevation_gain]."-".$num[average_speed]."<br>";
     //}

     //Now itterate through the main results, picking out the HIITs and summarising them
     foreach($json_a as $num)
     {
       if (substr($num[name],0,4) == "HIIT") //Check for HIIT sessions
       {
       //This is an entry with a HIIT
       $hiitNameDate = $num[name].",".$num[start_date_local].",";
       //Download the associated lap
       $activityNumber = $num[id];
       //Form the URL
       $lapURL = "https://www.strava.com/api/v3/activities/".$activityNumber."/laps?access_token=<your token here>";
       //Do cURL with this URL
       $curl = curl_init();
       curl_setopt ($curl, CURLOPT_URL, $lapURL);
       curl_setopt($curl, CURLOPT_RETURNTRANSFER, 1);
       $lapResult = curl_exec ($curl);
       curl_close ($curl);
       //Turn into an array we can parse
       $json_b=json_decode($lapResult,true);
       foreach($json_b as $lapNum)
         {
         echo $hiitNameDate.$lapNum[name].",Ave Cadence,".$lapNum[average_cadence]."<br>";
         echo $hiitNameDate.$lapNum[name].",Ave Heart,".$lapNum[average_heartrate]."<br>";
         echo $hiitNameDate.$lapNum[name].",Max Heart,".$lapNum[max_heartrate]."<br>";
         }
       }
     }
   ?>
      <h1>Summary of HIIT Activity</h1>
      <p><?php echo $hiitSummary ?></p>
    <p>Warning: This only shows a max of 200 Stravas!  Will have to play with  pages after that...</p>
  </body>
</html>


Saturday, 22 November 2014

Raspberry Pi and Strava API #1

My 3 favourite things in order are:
  • Being a Dad
  • Being a Geek
  • Doing exercise (cycling, running, swimming and general physical jerks).
I recently found a way to combine the last two on this list!

I created a LAMP webserver on my RasPi  (using this guide) and proceeded to muck about with various bits of HTML (basic made up pages), PHP, CSS and Javascript.  This enabled me to create a simple home intranet that cycled through various pages of "interesting" information:


...but what I really wanted was some new and interesting data to process and present on my intranet.

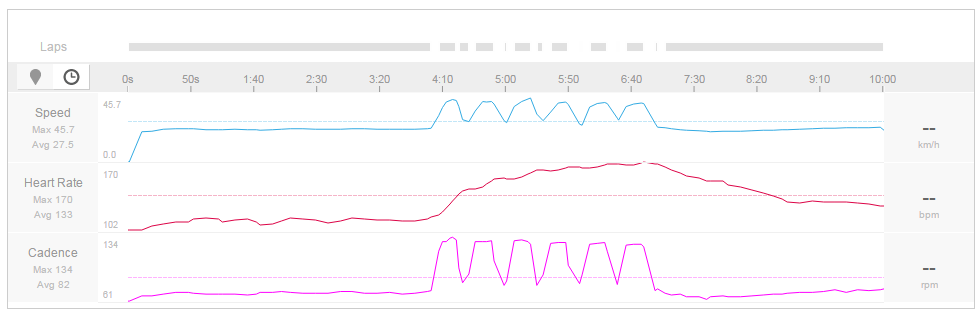
For a recent major birthday I got a present that's useful for my third hobby.  It's a Garmin Forerunner 910XT, a GPS multi-sports watch allowing me to log and track runs, bike rides and swims.  In it's own right it's a cool gadget for a geek; for example allowing you to track open water swims by logging GPS points as and when your wrist pops put the water.  Here's one I did earlier that was an accurate record of a short lake swim I did:


I upload all my exercise logs to Strava and whilst browsing around the site I came across details of the Strava API.  This enables you to build your own custom web pages and applications based upon exercise data you have logged on Strava.  First you need to go to the Strava developer site to log your application and get an API key.  Then you can call the API using URLs like this (which just lists all activities):

https://www.strava.com/api/v3/activities?access_token=<your token here>&per_page=200

This yields a JSON response which you can parse; for example picking out particular activities and looking at them in detail:

So:

https://www.strava.com/api/v3/activities/188107339?access_token=<your token here>&per_page=200

...gives:


{"id":188107339,"resource_state":3,"external_id":"activity_579805014.tcx","upload_id":208194475,"athlete":{"id":43095234,"resource_state":1},"name":"Dutch Lake Swim","distance":195.3,"moving_time":59,"elapsed_time":484,"total_elevation_gain":0.0,"type":"Swim","start_date":"2014-08-22T15:51:31Z","start_date_local":"2014-08-22T08:51:31Z","timezone":"(GMT-08:00) America/Vancouver","start_latlng":[51.65,-120.06],"end_latlng":[51.65,-120.06],"location_city":null,"location_state":"British Columbia","location_country":"Canada","start_latitude":51.65,"start_longitude":-120.06,"achievement_count":0,"kudos_count":0,"comment_count":0,"athlete_count":1,"photo_count":0,"map":{"id":"a188102339","polyline":"ofgzH|jx{U@wBKCYtBf@F","resource_state":3,"summary_polyline":"ofgzH|jx{UI{BL|B"},"trainer":false,"commute":false,"manual":false,"private":false,"flagged":false,"gear_id":"g397875","average_speed":3.31,"max_speed":0.6,"truncated":null,"has_kudoed":false,"description":"Garmin Accurate on Course and Distance","calories":0,"segment_efforts":[],"gear":{"id":"g397875","primary":true,"name":"Brooks blue ones","resource_state":2,"distance":135654.0}}

So with some PHP jiggery-pokery I created this intranet page to summarise my Strava activities in a new and interesting way:


All the PHP and HTML is listed below.  Note I'm a novice in this area so 0 marks for style I know...

<!DOCTYPE html>
<html>
  <head>
    <meta charset="UTF-8">
    <title>Weeks Family Strava Fun</title>
    <link rel="stylesheet" type="text/css" href="/stylesheet/style1.css">
  </head>
  <body>
   <!-- Get the value from Strava-->
   <?php
     //Use cURL to get the value from Strava.  Max 200 actvities per file.  After that will need to play with pages...
     $curl = curl_init();
     curl_setopt ($curl, CURLOPT_URL, "https://www.strava.com/api/v3/activities?access_token=<your key here>");
     curl_setopt($curl, CURLOPT_RETURNTRANSFER, 1);
     $result = curl_exec ($curl);
     curl_close ($curl);
     $json_a=json_decode($result,true);
     //Good debug code
     //foreach($json_a as $num)
     //{
     //print $num[start_date]."-".$num[name]."-".$num[type]."-".$num[distance]."-".$num[total_elevation_gain]."-".$num[average_speed]."<br>";
     //}
     //Some code for themain summary that goes in the middle of the top of the page
     //First see if we write km or m
     if ($json_a[0][distance] > 999)
     {
     $distanceToWrite = round(($json_a[0][distance] / 1000),1)."km";
     }
     else
     {
     $distanceToWrite = round($json_a[0][distance],1)."m";
     }
     //Now form the last exercise string to go at the top
     $lastExercise = $json_a[0][type]."-".$distanceToWrite;

     //Now we want some variables for a table that shows Activity,Activity Count,Total Distance (in km)
     //Also use this for fastest, longest and climingest activities
     foreach($json_a as $num)
     {
       if ($num[type] == "Run")
       {
       //Add distance and activity count
       $runCount = $runCount + 1;
       $runDistance = $runDistance + $num[distance];
       //Find the longest activity
       if ($num[distance] > $maxRunDistance)
         {
         $maxRunDistance = $num[distance];
         $maxRunExplanation = substr($num[start_date],0,10)."-".$num[name]."-".round($num[distance]/1000,2)."km";
         }
       //Find the fastest actvity
       if ($num[average_speed] > $fastestRun)
         {
         $fastestRun = $num[average_speed];
         $fastestRunExplanation = substr($num[start_date],0,10)."-".$num[name]."-".round(((1/($num[average_speed] / 1000))/60),2)." minutes per km";
         }
       //Find the activity with the most climbing
       if ($num[total_elevation_gain] > $mostClimbRun)
         {
         $mostClimbRun = $num[total_elevation_gain];
         $mostClimbRunExplanation = substr($num[start_date],0,10)."-".$num[name]."-".$num[total_elevation_gain]."m";
         }
       }
       elseif ($num[type] == "Ride")
       {
       //Add distance and activity count
       $rideCount = $rideCount + 1;
       $rideDistance = $rideDistance + $num[distance];
       //Find the longest activity
       if ($num[distance] > $maxRideDistance)
         {
         $maxRideDistance = $num[distance];
         $maxRideExplanation = substr($num[start_date],0,10)."-".$num[name]."-".round($num[distance]/1000,2)."km";
         }
       //Find the fastest activity
       if ($num[average_speed] > $fastestRide)
         {
         $fastestRide = $num[average_speed];
         $fastestRideExplanation = substr($num[start_date],0,10)."-".$num[name]."-".round((($num[average_speed]/1000)*3600),2)." km per hour";
         }
       //Find the activity with the most climbing
       if ($num[total_elevation_gain] > $mostClimbRide)
         {
         $mostClimbRide = $num[total_elevation_gain];
         $mostClimbRideExplanation = substr($num[start_date],0,10)."-".$num[name]."-".$num[total_elevation_gain]."m";
         }
       }
       elseif ($num[type] == "Swim")
       {
       //Add distance and activity count
       $swimCount = $swimCount + 1;
       $swimDistance = $swimDistance + $num[distance];
       //Find the longest activity
       if ($num[distance] > $maxSwimDistance)
         {
         $maxSwimDistance = $num[distance];
         $maxSwimExplanation = substr($num[start_date],0,10)."-".$num[name]."-".$num[distance];
         }
       }
     }
     //Turn all the distances in to km
     $runDistance = round(($runDistance / 1000),1);
     $rideDistance = round(($rideDistance / 1000),1);
     $swimDistance = round(($swimDistance / 1000),1);
     //Put in the context figures.  First the %of a channel swim (which is 34 km)
     $swimContext = round(100*($swimDistance / 34),1)."% of the distance from Dover to Calais";
     //Now the ride context which is the % of the distance from London to Sydney which is 16885 km
     $rideContext = round(100*($rideDistance / 16885),1)."% of the distance from London to Sydney";
     //Finally run context which is the distance for a LEJOG, 970km
     $runContext = round(100*($runDistance / 970),1)."% of the distance from Land's End to John o' Groats";
     ?>
      <h3>Last Strava: <?php echo substr($json_a[0][start_date],0,10)." - ".$json_a[0][name] ?></h3>
      <div id="container" style="width:750px">
        <div id="left" style="height:60px;width:250px;float:left;text-align:right">
          <img src="/images/strava.jpg" alt="Strava" width="100" height="60">
        </div>
        <div id="middle" style="height:60px;width:250px;float:left;background-color:green;text-align:center;vertical-align:middle">
          <p><font size="5"><?php echo $lastExercise ?></font></p>
        </div>
        <div id="right" style="height:60px;width:250px;float:left;">
          <img src="/images/strava.jpg" alt="Strava" width="100" height="60">
        </div>
      </div>
      <br><br><br>
      <!-- Show a summary table of all Stravas-->
      <h3>Summary of all Stravas:</h3>
      <table>
        <tr>
          <th></th>
          <th>Activity Count</th>
          <th>Distance (km)</th>
          <th>Context</th>
        </tr>
        <tr>
          <td><img src="/images/swim.PNG" alt="Swim" width="25" height="25"></td>
          <td><?php echo $swimCount ?></td>
          <td><?php echo $swimDistance ?></td>
          <td><?php echo $swimContext ?></td>
        </tr>
        <tr>
          <td><img src="/images/bike.PNG" alt="Ride" width="25" height="25"></td>
          <td><?php echo $rideCount ?></td>
          <td><?php echo $rideDistance ?></td>
          <td><?php echo $rideContext ?></td>
        </tr>
        <tr>
          <td><img src="/images/run.PNG" alt="Run" width="25" height="25"></td>
          <td><?php echo $runCount ?></td>
          <td><?php echo $runDistance ?></td>
          <td><?php echo $runContext ?></td>
        </tr>
    </table>
    <h3>Strava Records:</h3>
    <table>
      <tr>
        <th></th>
        <th><img align="center" src="/images/swim.PNG" alt="Swim" width="25" height="25"></th>
        <th><img align="center" src="/images/bike.PNG" alt="Ride" width="25" height="25"></th>
        <th><img align="center" src="/images/run.PNG" alt="Run" width="25" height="25"></th>
      </tr>
      <tr>
        <td>Longest</td>
        <td><?php echo $maxSwimExplanation ?></td>
        <td><?php echo $maxRideExplanation ?></td>
        <td><?php echo $maxRunExplanation ?></td>
      </tr>
      <tr>
        <td>Fastest</td>
        <td>n/a</td>
        <td><?php echo $fastestRideExplanation ?></td>
        <td><?php echo $fastestRunExplanation ?></td>
      </tr>
      <tr>
        <td>Most Climbing</td>
        <td>n/a</td>
        <td><?php echo $mostClimbRideExplanation ?></td>
        <td><?php echo $mostClimbRunExplanation ?></td>
      </tr>

    </table>
    <p>Warning: This only shows a max of 200 Stravas!  Will have to play with  pages after that...</p>
  </body>
</html>