Sunday, 17 April 2016

Strava and Fitbit API Mash-up Using Raspberry Pi and Python

Previously I blogged on how I used data from the Fitbit API to look at cadence information gathered during runs I'd logged on Strava.

Now that was all very good and informative but:
  • I analysed the Strava results manually.  i.e. Stepped through the website and noted down dates, times and durations of runs.
  • I used the Fitbit OAUTH1.0 URL builder website.  Very manual and using OAUTH1.0, (since deprecated, see here on using OAUTH2.0).
...so it  was time to automate the process and upgrade to OAUTH2.0!  Hence it was time to break out the Raspberry Pi and get coding.

Full code at the bottom of this post (to not interrupt the flow) but the algorithm is as follows:
  • Loop, pulling back activity data from the Strava API (method here).
  • Select each Strava run (i.e. filter out rides and swims) and log key details (start date/time, duration, name, distance)
  • Double check if the date of the run was after I got my Fitbit (the FitbitEpoch constant).  If it is, form the Fitbit API URL using date and time parameters derived from the Strava API output.
  • Call the Fitbit API using the OAUTH2.0 method.
  • Log the results for later processing.
...easy (the trickiest bit was date/time manipulation)!

This provides output like this:
pi@raspberrypi:~/Exercise/logs $ head steps_log_1.txt
2016-04-16T09:02:03Z_4899.7,Parkrun 20160416,1,09:02:00,100
2016-04-16T09:02:03Z_4899.7,Parkrun 20160416,2,09:03:00,169
2016-04-16T09:02:03Z_4899.7,Parkrun 20160416,3,09:04:00,170
2016-04-16T09:02:03Z_4899.7,Parkrun 20160416,4,09:05:00,171
2016-04-16T09:02:03Z_4899.7,Parkrun 20160416,5,09:06:00,172
2016-04-16T09:02:03Z_4899.7,Parkrun 20160416,6,09:07:00,170
2016-04-16T09:02:03Z_4899.7,Parkrun 20160416,7,09:08:00,170
2016-04-16T09:02:03Z_4899.7,Parkrun 20160416,8,09:09:00,170
2016-04-16T09:02:03Z_4899.7,Parkrun 20160416,9,09:10:00,168
2016-04-16T09:02:03Z_4899.7,Parkrun 20160416,10,09:11:00,170

So a date and time,name of the run, minute of run and step count.

So easy to filter out interesting runs to compare:
pi@raspberrypi:~/Exercise/logs $ grep 20150516 steps_log_1.txt > parkrun_steps_1.txt
pi@raspberrypi:~/Exercise/logs $ grep 20160416 steps_log_1.txt >> parkrun_steps_1.txt

Then import to R for post analysis and plotting:
> parkrun1 <- read.csv(file=file.choose(),head=FALSE,sep=",")

> colnames(parkrun1) <- c("DateTimeDist","Name","Minute","TimeOfDay","Steps") 
> head(parkrun1)
                 DateTimeDist                              Name Minute TimeOfDay Steps
1 2015-05-16T09:00:00Z_5000.0 Naked Winchester Parkrun 20150516      1  09:00:00    85
2 2015-05-16T09:00:00Z_5000.0 Naked Winchester Parkrun 20150516      2  09:01:00   105
3 2015-05-16T09:00:00Z_5000.0 Naked Winchester Parkrun 20150516      3  09:02:00   107
4 2015-05-16T09:00:00Z_5000.0 Naked Winchester Parkrun 20150516      4  09:03:00   136
5 2015-05-16T09:00:00Z_5000.0 Naked Winchester Parkrun 20150516      5  09:04:00   162
6 2015-05-16T09:00:00Z_5000.0 Naked Winchester Parkrun 20150516      6  09:05:00   168

library(ggplot2)
> ggplot(data = parkrun1, aes(x = Minute, y = Steps, color = Name)) 
+ geom_point() + geom_line() 
+ labs(x="Minute", y="Steps") + ggtitle("Running Cadence - Parkrun") 

Yielding this graph:

Interesting that I took longer to get going on the 2015 run, maybe there was congestion at the start.  The key thing I was looking for was the "steady state" cadence comparison between 2015 and 2016.  It's higher in 2016 which is exactly what I wanted to see as it's something I've worked on improving.

Using the same method I plotted the chart below which shows a long run prior to a half-marathon then the half-marathon itself:


Now this is interesting. The cadence was slightly higher for the whole of the training run (blue line) and much more consistent.  For the half-marathon itself (red line) my cadence really tailed off which is in tune with my last post where I analysed my drop off in speed over the final quarter of the run.

Here's all the code.  Modify for your API credentials, file system and Fitbit "Epoch" accordingly:

pi@raspberrypi:~/Exercise $ more strava_fitbit_v1.py
#here's a typical Fitbit API URL
#FitbitURL = "https://api.fitbit.com/1/user/-/activities/steps/date/2016-01-31/1d/1min/time/09:00/09:15.json"

import urllib2
import base64
import json
from datetime import datetime, timedelta
import time
import urllib
import sys
import os

#The base URL we use for activities
BaseURLActivities = "https://www.strava.com/api/v3/activities?access_token=<Strava_Token_Here>per_page=200&page="
StepsLogFile = "/home/pi/Exercise/logs/steps_log_1.txt"

#Start element of Fitbit URL
FitbitURLStart = "https://api.fitbit.com/1/user/-/activities/steps/date/"

#Other constants
MyFitbitEpoch = "2015-01-26"

#Use this URL to refresh the access token
TokenURL = "https://api.fitbit.com/oauth2/token"

#Get and write the tokens from here
IniFile = "/home/pi/Exercise/tokens.txt"

#From the developer site
OAuthTwoClientID = "FitBitClientIDHere"
ClientOrConsumerSecret = "FitbitSecretHere"

#Some contants defining API error handling responses
TokenRefreshedOK = "Token refreshed OK"
ErrorInAPI = "Error when making API call that I couldn't handle"

#Get the config from the config file.  This is the access and refresh tokens
def GetConfig():
  print "Reading from the config file"

  #Open the file
  FileObj = open(IniFile,'r')

  #Read first two lines - first is the access token, second is the refresh token
  AccToken = FileObj.readline()
  RefToken = FileObj.readline()

  #Close the file
  FileObj.close()

  #See if the strings have newline characters on the end.  If so, strip them
  if (AccToken.find("\n") > 0):
    AccToken = AccToken[:-1]
  if (RefToken.find("\n") > 0):
    RefToken = RefToken[:-1]

  #Return values
  return AccToken, RefToken

def WriteConfig(AccToken,RefToken):
  print "Writing new token to the config file"
  print "Writing this: " + AccToken + " and " + RefToken

  #Delete the old config file
  os.remove(IniFile)

  #Open and write to the file
  FileObj = open(IniFile,'w')
  FileObj.write(AccToken + "\n")
  FileObj.write(RefToken + "\n")
  FileObj.close()

#Make a HTTP POST to get a new
def GetNewAccessToken(RefToken):
  print "Getting a new access token"

  #RefToken = "e849e1545d8331308eb344ce27bc6b4fe1929d8f1f9f3a056c5636311ba49014"

  #Form the data payload
  BodyText = {'grant_type' : 'refresh_token',
              'refresh_token' : RefToken}
  #URL Encode it
  BodyURLEncoded = urllib.urlencode(BodyText)
  print "Using this as the body when getting access token >>" + BodyURLEncoded

  #Start the request
  tokenreq = urllib2.Request(TokenURL,BodyURLEncoded)
  #Add the headers, first we base64 encode the client id and client secret with a : inbetween and create the authorisation header
  tokenreq.add_header('Authorization', 'Basic ' + base64.b64encode(OAuthTwoClientID + ":" + ClientOrConsumerSecret))
  tokenreq.add_header('Content-Type', 'application/x-www-form-urlencoded')

  #Fire off the request
  try:
    tokenresponse = urllib2.urlopen(tokenreq)

    #See what we got back.  If it's this part of  the code it was OK
    FullResponse = tokenresponse.read()

    #Need to pick out the access token and write it to the config file.  Use a JSON manipluation module
    ResponseJSON = json.loads(FullResponse)

    #Read the access token as a string
    NewAccessToken = str(ResponseJSON['access_token'])
    NewRefreshToken = str(ResponseJSON['refresh_token'])
    #Write the access token to the ini file
    WriteConfig(NewAccessToken,NewRefreshToken)

    print "New access token output >>> " + FullResponse
  except urllib2.URLError as e:
    #Gettin to this part of the code means we got an error
    print "An error was raised when getting the access token.  Need to stop here"
    print e.code
    print e.read()
    sys.exit()

#This makes an API call.  It also catches errors and tries to deal with them
def MakeAPICall(InURL,AccToken,RefToken):
  #Start the request
  req = urllib2.Request(InURL)

  #Add the access token in the header
  req.add_header('Authorization', 'Bearer ' + AccToken)

  print "I used this access token " + AccToken
  #Fire off the request
  try:
    #Do the request
    response = urllib2.urlopen(req)
    #Read the response
    FullResponse = response.read()

    #Return values
    return True, FullResponse
  #Catch errors, e.g. A 401 error that signifies the need for a new access token
  except urllib2.URLError as e:
    print "Got this HTTP error: " + str(e.code)
    HTTPErrorMessage = e.read()
    print "This was in the HTTP error message: " + HTTPErrorMessage
    #See what the error was
    if (e.code == 401) and (HTTPErrorMessage.find("Access token invalid or expired") > 0):
      GetNewAccessToken(RefToken)
      return False, TokenRefreshedOK
    elif (e.code == 401) and (HTTPErrorMessage.find("Access token expired") > 0):
      GetNewAccessToken(RefToken)
      return False, TokenRefreshedOK
    #Return that this didn't work, allowing the calling function to handle it
    return False, ErrorInAPI


#This function takes a date and time and checks whether it's after a given date
def CheckAfterFitbit(InDateTime):
  #See how many days there's been between today and my first Fitbit date.
  StravaDate = datetime.strptime(InDateTime,"%Y-%m-%dT%H:%M:%SZ")    #First Fitbit date as a Python date object
  FitbitDate = datetime.strptime(MyFitbitEpoch,"%Y-%m-%d")                   #Last Fitbit date as a Python date object

  #See if the provided date is greater than the Fitbit date.  If so, return True, else return  false
  if ((StravaDate - FitbitDate).days > -1):
    return True
  else:
    return False

#Forms the full URL to use for Fitbit.  Example:
#https://api.fitbit.com/1/user/-/activities/steps/date/2016-01-31/1d/1min/time/09:00/09:15.json
def FormFitbitURL(URLSt,DtTmSt,Dur):
  #First we need to add the date component which should be the first part of the date and time string we got from Strava.  Add the next few static bits as well
  FinalURL = URLSt + DtTmSt[0:10] + "/1d/1min/time/"

  #Now add the first time part which is also provided as a parameter. This will take us back to the start of the minute STrava started which is what we want
  FinalURL = FinalURL + DtTmSt[11:16] + "/"

  #Now we need to compute the end time which needs a bit of maths as we need to turn the start date into a Python date object and then add on elapsed seconds,
  #turn back to a string and take the time part
  StravaStartDateTime = datetime.strptime(DtTmSt,"%Y-%m-%dT%H:%M:%SZ")

  #Now add elapsed time using time delta function
  StravaEndDateTime = StravaStartDateTime + timedelta(seconds=int(Dur))
  EndTimeStr = str(StravaEndDateTime.time())

  #Form the final URL
  FinalURL = FinalURL + EndTimeStr[0:5] + ".json"
  return FinalURL


#@@@@@@@@@@@@@@@@@@@@@@@@@@@This is the main part of the code
#Open the file to use
MyFile = open(StepsLogFile,'w')

#Loop extracting data.  Remember it comes in pages.  Initialise variables first, including the tokens to use
EndFound = False
LoopVar = 1
AccessToken = ""
RefreshToken = ""

#Get the tokens from the config file
AccessToken, RefreshToken = GetConfig()

#Main loop - Getting all activities
while (EndFound == False):
  #Do a HTTP Get - First form the full URL
  ActivityURL = BaseURLActivities + str(LoopVar)
  StravaJSONData = urllib2.urlopen(ActivityURL).read()

  if StravaJSONData != "[]":   #This checks whether we got an empty JSON response and so should end
    #Now we process the JSON
    ActivityJSON = json.loads(StravaJSONData)

    #Loop through the JSON structure
    for JSONActivityDoc in ActivityJSON:
      #See if it was a run.  If so we're interested!!
      if (str(JSONActivityDoc["type"]) == "Run"):
        #We want to grab a date, a start time and a duration for the Fitbit API.  We also want to grab a distance which we'll use as a grpah legend
        print "@@@@@@@@@@@@@@@@@@@@@@@@@@@@@@@@@@@@@@@@@@@@@@@@@@@@@@@@@@@@@@@@@@@@@@@@@@@@@@@@@@@@@@@@@"
        StartDateTime = str(JSONActivityDoc["start_date_local"])
        StravaDuration = str(JSONActivityDoc["elapsed_time"])
        StravaDistance = str(JSONActivityDoc["distance"])

        StravaName = str(JSONActivityDoc["name"])

        #See if it's after 2015-01-26 which is when I got my Fitbit
        if CheckAfterFitbit(StartDateTime):
          #Tell the user what we're doing
          print "Strava Date and Time: " +  StartDateTime
          print "Strava Duration: " + StravaDuration
          print "Strava Distance: " + StravaDistance

          #Form the URL to use for Fitbit
          FitbitURL = FormFitbitURL(FitbitURLStart,StartDateTime,StravaDuration)
          print "Am going to call FitbitAPI with: " + FitbitURL

          #Make the API call
          APICallOK, APIResponse = MakeAPICall(FitbitURL, AccessToken, RefreshToken)
          #See how this came back.
          if not APICallOK:    #An error in the response.  If we refreshed tokens we go again.  Else we exit baby!
            if (APIResponse == TokenRefreshedOK):
              #Just make the call again
              APICallOK, APIResponse = MakeAPICall(FitbitURL, AccessToken, RefreshToken)
            else:
              print "An error occurred when I made the Fitbit API call.  Going to have to exit"
              sys.exit(0)

          #If we got to this point then we must have got an OK response.  We need to process this into the text file.  Format is:
          #Date_Distance,MinuteWithinRun,Time,Steps
          #print APIResponse
          ResponseAsJSON = json.loads(APIResponse)
          MinNum = 1    #Use this to keep track of the minute within the run, incrementing each time
          for StepsJSON in ResponseAsJSON["activities-steps-intraday"]["dataset"]:
            OutString = StartDateTime + "_" + StravaDistance + "," + StravaName + "," + str(MinNum) + "," + str(StepsJSON["time"]) + "," + str(StepsJSON["value"]) + "\r\n"
            #Write to file
            MyFile.write(OutString)
            #Increment the loop var
            MinNum += 1

    #Set up for next loop
    LoopVar += 1
  else:
    EndFound = True

#Close the log file
MyFile.close()

Friday, 8 April 2016

Half Marathon Analysis Using Python and R

I recently did a half-marathon run and, whilst I did a personal best, I paced it really badly meaning the last 5km were hard and slow.  This, coupled with some interesting results data that was published gave me a Geek idea!

Here's a snippet from the results PDF:


So for all 10,000 runners a whole plethora of data to compare and contrast.  In particular I was interested in how my 5k splits compared with everyone else's.  Mine were:
  • 0-5km = 22m0s
  • 5-10km = 21m56s
  • 10-15km = 22m03s
  • 15-20km = 23m37s
So really consistent across the first 15km then a bad fade over the last 5.  In fact a quick calculation shows I was 7.4% slower for the last 5km than the average for the first 15km.  However before I beat myself up over this I needed to know whether this was typical, better than average or worse than average.

All the results were in a PDF and what a pain that turned out to be to turn into something I could process.  I tried various online services, saving as text in Adobe Acrobat, avoided the paid for Adobe service and tried a Python module called pyPdf but none would allow me to turn the PDF file into a well formed text file for processing. 

In the end I opened the PDF in Adobe Acrobat, copied all the data then pasted it into Windows Notepad.  The data looked like this (abridged):

GunPos RaceNo Name Gender Cat Club GunTime ChipPos ChipTime Chip 5Km Split Chip 10Km Split Chip 15Km Split Chip 20Km Split 

5 Robert Mbithi M 01:03:57 1 01:03:57 00:15:08 00:29:39 00:44:44 01:00:24 
72 Scott Overall M 01:05:13 2 01:05:13 00:15:33 00:30:46 00:46:13 01:01:59 
81 Chris Thompson M ALDERSHOT FARNHAM & DISTRICT AC 01:05:14 3 01:05:14 00:15:33 00:30:46 00:46:13 01:01:59 
6 Paul Martelletti M RUN FAST 01:05:15 4 01:05:15 00:15:33 00:30:46 00:46:13 01:01:59 
82 Gary Murray M 01:06:12 5 01:06:12 00:15:33 00:30:46 00:46:18 01:02:37 

I then had to work pretty hard to turn this into a file that could be read into my favourite analysis package, R.  Looking at the data above you can see:
  • There's spaces between fields.
  • There's spaces within fields.
  • There's missing fields (e.g. age and club).
  • The PDF format means some long fields overlap with each other.
I actually had to write quite a lot of Python script to turn this into a CSV.  I've put this in the bottom of this post so as to know interrupt the flow (baby). In the script I also added some fields where the hh:mm:ss format times were turned into simple seconds to help with the maths.

Eventually I had a CSV file to play with and I read it into R using this command:

> rhm1 <- read.csv(file=file.choose(),head=FALSE,sep=",")

I added some column names with:

> colnames(rhm1) <- c("GunPos","RaceNo","Gender","Name","AgeCat","Club","GunTime","GunTimeSecs","ChipPos","ChipTime","ChipTimeSecs","FiveKSplit","FiveKSplitSecs","TenKSplit","TenKSplitSecs","FifteenKSplit","FifteenKSplitSecs","TwentyKSplit","TwentyKSplitSecs")

I then computed the net 5k splits (from the elapsed time) with:
> rhm1$TenKSplitSecsNet <- rhm1$TenKSplitSecs - rhm1$FiveKSplitSecs
> rhm1$FifteenKSplitSecsNet <- rhm1$FifteenKSplitSecs - rhm1$TenKSplitSecs
> rhm1$TwentyKSplitSecsNet <- rhm1$TwentyKSplitSecs - rhm1$FifteenKSplitSecs

I then computed the mean time for the first 3 splits:
> rhm1$FirstFifteenKMean <- (rhm1$FiveKSplitSecs + rhm1$TenKSplitSecsNet + rhm1$FifteenKSplitSecsNet) / 3

...and used this to compute the percentage difference in the last 5k split from the average of the first 3:
rhm1$Last5KDelta <- (rhm1$TwentyKSplitSecsNet - rhm1$FirstFifteenKMean) / rhm1$FirstFifteenKMean

Finding me in the data:
> rhm1[grep("Geek Dad",rhm1$Name),]
    GunPos RaceNo Gender       Name AgeCat Club  GunTime GunTimeSecs ChipPos 
869    869  13759      M   Geek Dad     40      01:39:12        5952     918 
ChipTime ChipTimeSecs FiveKSplit FiveKSplitSecs TenKSplit TenKSplitSecs 
01:34:54         5694   00:22:00           1320  00:43:56          2636      
FifteenKSplit
01:05:59
    FifteenKSplitSecs TwentyKSplit TwentyKSplitSecs TenKSplitSecsNet 
                 3959     01:29:36             5376             1316             

FifteenKSplitSecsNet TwentyKSplitSecsNet FirstFifteenKMean Last5KDelta
                1323                1417          1319.667    0.073756

I could then plot all the data using ggplot.  I chose a density plot to look at the proportions of each "Last5KDelta" value.  Here's the command to create the plot (and add some formatting and labels).

> library(ggplot2)
qplot(rhm1$Last5KDelta, geom="density", main="Density Plot of Last 5K Delta",xlab="% Delta", ylab="Density", fill=I("blue"),col=I("red"), alpha=I(.2),xlim=c(-1,1))

So nice looking chart and I can see that there's more people who were slower in the final 5k (positive value) than faster.  Looking good!

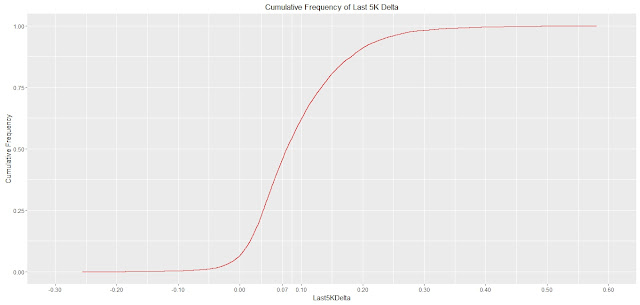
However this didn't tell me whether I was better or worse than average.  For this I need a cumulative frequency plot.  This uses the stat_ecdf (empirical cumulative distribution function) to create the plot.  The command below does this, tweaks the x axis to make it tighter and puts in an extra a axis tick at 7% so I can see where "I" sit on the graph.

> chart1 <- ggplot(rhm1,aes(Last5KDelta)) + stat_ecdf(geom = "step",colour="red")  + scale_x_continuous(limits=c(-0.3,0.6),breaks=c(-0.3,-0.2,-0.1,0,0.07,0.1,0.2,0.3,0.4,0.5,0.6))
chart1 + ggtitle("Cumulative Frequency of Last 5K Delta") + labs(y="Cumulative Frequency")


So get in!  0.7% sits at less than 50% cumulative frequency!  More people faded more than me over the last 5k.

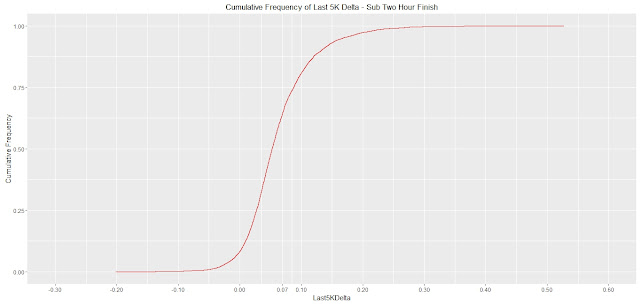
However somewhere behind me was a man carrying a fridge!  I decided to look at just those who completed the run in under 2 hours by doing:

> rhmSubTwo <- rhm1[rhm1$ChipTimeSecs<7200,]

Which gives this chart:

Darn it.  About 68% of this cohort faded less than me.  Not looking so good now...

What about those equal or better than me?
> rhmSubMe <- rhm1[rhm1$ChipTimeSecs<5694,]

Looking pretty poor now :-(.  I must pace myself better next time.

Here's all the Python code to create the .csv file:

InputFile = "/home/pi/Documents/RHM/VitalityReadingHalfMarathon_v2.txt"
OutputFile = "/home/pi/Documents/RHM/RHM.csv"

#Open the file
InFile = open(InputFile,'r')
OutFile = open(OutputFile,'w')

#This takes a time in h:m:s or similar and turns to seconds.
def TimeStringToSecs(InputString):
  #There are 2 cases
  #1)A proper time string hh:mm:ss
  #2)Something else with letters and numbers munged together
  if len(InputString) == 8:
    #Compute the time in seconds
    SecondsCount = (float(InputString[0:2]) * 3600) + (float(InputString[3:5]) * 60) + float(InputString[6:8])
    return str(SecondsCount)
  else:
    print "Got this weird string: " + InputString
    return "-1"

for i in range(1,10981):
  #Initialise variables
  Outstring = ""
  EndString = ""
  MidString = ""
  GenderFound = False

  #Read a line
  InString = InFile.readline().rstrip()

  print InString

  #Split the line based upon a space
  SplitStr1 = InString.split(" ")

  #We can rely on the first field which is gun position and second field which is race number.  But don't put Gun position as R ignores it!
  OutString = SplitStr1[1] + ","

  #We can also rely on the last 7 fields of the line which respectively are GunTime,ChipPos,ChipTime,5KSplit,10KSplit,15KSplit,20KSplit
  NumFields = len(SplitStr1)
  #Compute the end of the output string
  for z in range(7,0,-1):
    #print "z=" + str(z) + ".  Equates to" + SplitStr1[NumFields - z]
    EndString = EndString + SplitStr1[NumFields - z] + ","
    #Look up the time in seconds.  Not for case 6 which is the gun position
    if (z != 6):
      EndString = EndString + TimeStringToSecs(SplitStr1[NumFields - z]) + ","
  #Hardest bit last.  Name, Gender, Age and Club.  Gender is reliably there, except for long names where it gets mangled.
  #Hence find it and you know everything before is the name
  for a in range(0,len(SplitStr1)):
    if (SplitStr1[a] == "M") or (SplitStr1[a] == "F"):
      #THis is the position of the gender which is the "anchor" for everything else
      GenderPos = a
      #Add it to the middle part of the string.  No worries it's in different order to file.
      MidString = SplitStr1[a] + ","
      #Say we found the gender.
      GenderFound = True

  #Process for the case where gender was found
  if GenderFound:
    #Now we know everything before (exclusing first two numbers was the name.  Add the parts of the name together.  The below code should handle
    #complex names
    for b in range(2,GenderPos):
      MidString = MidString + SplitStr1[b]
      #See if it's not the last part of the name.  If not add a space
      if (b < (GenderPos - 1)):
        MidString = MidString + " "
      else:
        MidString = MidString + ","

    #Now test the part after the gender position.  If it's "U23" or a number(but not 100 as cllubs start with this!) then this is the age category
    if (SplitStr1[GenderPos + 1] == "U23"):
      MidString = MidString + SplitStr1[GenderPos + 1] + ","
      #Log where the club might start
      ClubStartPos = GenderPos + 2
    elif SplitStr1[GenderPos + 1].isdigit():
      if SplitStr1[GenderPos + 1] != "100":
        MidString = MidString + SplitStr1[GenderPos + 1] + ","
        #Log where the club might start
        ClubStartPos = GenderPos + 2
      else:
        MidString = MidString + ","
        #Log where the club might start
        ClubStartPos = GenderPos + 1
    else:
      MidString = MidString + ","
      #Log where the club might start
      ClubStartPos = GenderPos + 1

    #So now everything from ClubStartPos "might" be a club.  We can test this by seeing if what might be the club is actually gun
    #time which is 7th  from the end
    if (SplitStr1[ClubStartPos] == SplitStr1[NumFields - 7]):
      MidString = MidString + ","
    else:
      #Loop adding elements of the club
      for c in range(ClubStartPos,NumFields - 7):
        MidString = MidString + SplitStr1[c]
        #See whether to add a space
        if (c < (NumFields - 8)):
          MidString = MidString + " "
        else:
          MidString = MidString + ","
  else: #Where there is no gender.  Add commas to represent Name,Age and Club and somethign to say it was a long name!!!
    MidString = ",Long Name,,,"

  #print OutString
  #print MidString
  #print EndString

  print OutString + MidString + EndString
  OutFile.write(OutString + MidString + EndString + '\r\n')

InFile.close()
OutFile.close()

Saturday, 2 April 2016

What to do with 3.5 Million Heart Rate Monitor Readings? Part deux

In my last post I accessed 3.5 million of my Fitbit Charge HR measured heart rate data points from the Fitbit API and created this chart:


So 3.5 million data points all plotted on top of each other on a chart.  Not that instructive so time to go back to basics.

First a simple statistical summary:

> summary(FitbitHeart1)
         Date               Time           HeartRate     
 2015-10-25:  12281   06:03:30:    307   Min.   : 45.00  
 2015-05-12:  11030   04:08:20:    306   1st Qu.: 61.00  
 2015-07-18:  10716   05:54:00:    306   Median : 68.00  
 2016-02-26:  10590   03:47:10:    305   Mean   : 74.61  
 2015-09-05:  10252   05:16:40:    304   3rd Qu.: 86.00  
 2015-09-30:   9935   04:30:10:    303   Max.   :204.00  
 (Other)   :3427686   (Other) :3490659                   
 DateTimePosix                
 Min.   :2015-01-26 00:00:00  
 1st Qu.:2015-05-10 00:00:00  
 Median :2015-08-20 00:00:00  
 Mean   :2015-08-21 16:54:28  
 3rd Qu.:2015-12-07 00:00:00  
 Max.   :2016-03-16 00:00:00  

So as a simple average (mean) my heart beats 74.61 times per minute.  It went down to mumimum of 45 (presumably when sleeping) and up to a maximum of 204 (presumably during crazy exercise).

Histograms are always good fun so let's plot one with qplot.  The extra parameters set the bin width to 1 and make the  bars a more interesting colour.

>library(ggplot2)
> qplot(FitbitHeart1$HeartRate, geom="histogram", binwidth=1,main="Histogram of Heart Rate Readings",xlab="Heart Rate", ylab="Count", fill=I("blue"),col=I("red"),alpha=I(.2)) 

...which yields...

Which has an interesting profile:

  • An initial peak of lower readings, most likely during sleep / resting periods.
  • A "plateau" between 75 and 90, most likely the range for general daytime when sitting, working, moving around etc.
  • A tail off between 91 and 125, most likely more active daytime stiff, e.g. walking around.
  • A long tail from 125 to 200, most likely when exercising.

You can also do this as a density plot which gives a nice smoothed curve:

> qplot(FitbitHeart1$HeartRate, geom="density", main="Density Plot of Heart Rate Readings",xlab="Heart Rate", ylab="Density", fill=I("blue"),col=I("red"), alpha=I(.2)) 

...yielding...


From the chart I can see that the mode heart rate value is around 60 but I need to compute a table of frequencies to double check this:

> mytable <- table (FitbitHeart1$HeartRate)
> head(mytable)

  45   46   47   48   49   50 

   2   24  173  469 1383 2951 

Turn into a data frame for easier analysis:

> mydf = data.frame(mytable)
> mydf
    Var1   Freq
1     45      2
2     46     24
3     47    173
4     48    469
5     49   1383
6     50   2951
7     51   6089
8     52  12264
9     53  25178
10    54  45433
11    55  69814
12    56  94612
13    57 115236
14    58 134504
15    59 145909
16    60 152036
17    61 151795
18    62 146968
19    63 138818
20    64 127946
21    65 116876

22    66 105957

So the mode is at 60 beats per minute!