Here's a snippet from the results PDF:
So for all 10,000 runners a whole plethora of data to compare and contrast. In particular I was interested in how my 5k splits compared with everyone else's. Mine were:
- 0-5km = 22m0s
- 5-10km = 21m56s
- 10-15km = 22m03s
- 15-20km = 23m37s
All the results were in a PDF and what a pain that turned out to be to turn into something I could process. I tried various online services, saving as text in Adobe Acrobat, avoided the paid for Adobe service and tried a Python module called pyPdf but none would allow me to turn the PDF file into a well formed text file for processing.
In the end I opened the PDF in Adobe Acrobat, copied all the data then pasted it into Windows Notepad. The data looked like this (abridged):
GunPos RaceNo Name Gender Cat Club GunTime ChipPos ChipTime Chip 5Km Split Chip 10Km Split Chip 15Km Split Chip 20Km Split
5 Robert Mbithi M 01:03:57 1 01:03:57 00:15:08 00:29:39 00:44:44 01:00:24
72 Scott Overall M 01:05:13 2 01:05:13 00:15:33 00:30:46 00:46:13 01:01:59
81 Chris Thompson M ALDERSHOT FARNHAM & DISTRICT AC 01:05:14 3 01:05:14 00:15:33 00:30:46 00:46:13 01:01:59
6 Paul Martelletti M RUN FAST 01:05:15 4 01:05:15 00:15:33 00:30:46 00:46:13 01:01:59
82 Gary Murray M 01:06:12 5 01:06:12 00:15:33 00:30:46 00:46:18 01:02:37
I then had to work pretty hard to turn this into a file that could be read into my favourite analysis package, R. Looking at the data above you can see:
- There's spaces between fields.
- There's spaces within fields.
- There's missing fields (e.g. age and club).
- The PDF format means some long fields overlap with each other.
Eventually I had a CSV file to play with and I read it into R using this command:
> rhm1 <- read.csv(file=file.choose(),head=FALSE,sep=",")
I added some column names with:
> colnames(rhm1) <- c("GunPos","RaceNo","Gender","Name","AgeCat","Club","GunTime","GunTimeSecs","ChipPos","ChipTime","ChipTimeSecs","FiveKSplit","FiveKSplitSecs","TenKSplit","TenKSplitSecs","FifteenKSplit","FifteenKSplitSecs","TwentyKSplit","TwentyKSplitSecs")
I then computed the net 5k splits (from the elapsed time) with:
> rhm1$TenKSplitSecsNet <- rhm1$TenKSplitSecs - rhm1$FiveKSplitSecs
> rhm1$FifteenKSplitSecsNet <- rhm1$FifteenKSplitSecs - rhm1$TenKSplitSecs
> rhm1$TwentyKSplitSecsNet <- rhm1$TwentyKSplitSecs - rhm1$FifteenKSplitSecs
I then computed the mean time for the first 3 splits:
> rhm1$FirstFifteenKMean <- (rhm1$FiveKSplitSecs + rhm1$TenKSplitSecsNet + rhm1$FifteenKSplitSecsNet) / 3
...and used this to compute the percentage difference in the last 5k split from the average of the first 3:
rhm1$Last5KDelta <- (rhm1$TwentyKSplitSecsNet - rhm1$FirstFifteenKMean) / rhm1$FirstFifteenKMean
Finding me in the data:
> rhm1[grep("Geek Dad",rhm1$Name),]
GunPos RaceNo Gender Name AgeCat Club GunTime GunTimeSecs ChipPos
869 869 13759 M Geek Dad 40 01:39:12 5952 918
ChipTime ChipTimeSecs FiveKSplit FiveKSplitSecs TenKSplit TenKSplitSecs
01:34:54 5694 00:22:00 1320 00:43:56 2636
FifteenKSplit
01:05:59
FifteenKSplitSecs TwentyKSplit TwentyKSplitSecs TenKSplitSecsNet
3959 01:29:36 5376 1316
FifteenKSplitSecsNet TwentyKSplitSecsNet FirstFifteenKMean Last5KDelta
1323 1417 1319.667 0.073756
I could then plot all the data using ggplot. I chose a density plot to look at the proportions of each "Last5KDelta" value. Here's the command to create the plot (and add some formatting and labels).
> library(ggplot2)
> qplot(rhm1$Last5KDelta, geom="density", main="Density Plot of Last 5K Delta",xlab="% Delta", ylab="Density", fill=I("blue"),col=I("red"), alpha=I(.2),xlim=c(-1,1))
So nice looking chart and I can see that there's more people who were slower in the final 5k (positive value) than faster. Looking good!
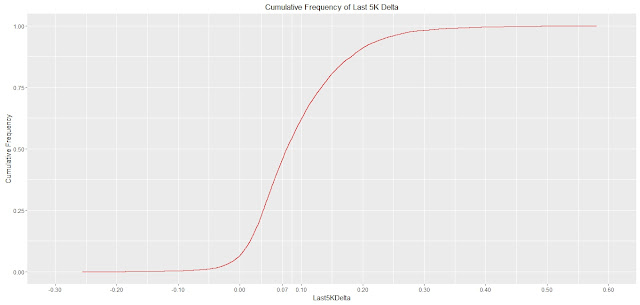
However this didn't tell me whether I was better or worse than average. For this I need a cumulative frequency plot. This uses the stat_ecdf (empirical cumulative distribution function) to create the plot. The command below does this, tweaks the x axis to make it tighter and puts in an extra a axis tick at 7% so I can see where "I" sit on the graph.
> chart1 <- ggplot(rhm1,aes(Last5KDelta)) + stat_ecdf(geom = "step",colour="red") + scale_x_continuous(limits=c(-0.3,0.6),breaks=c(-0.3,-0.2,-0.1,0,0.07,0.1,0.2,0.3,0.4,0.5,0.6))
chart1 + ggtitle("Cumulative Frequency of Last 5K Delta") + labs(y="Cumulative Frequency")
So get in! 0.7% sits at less than 50% cumulative frequency! More people faded more than me over the last 5k.
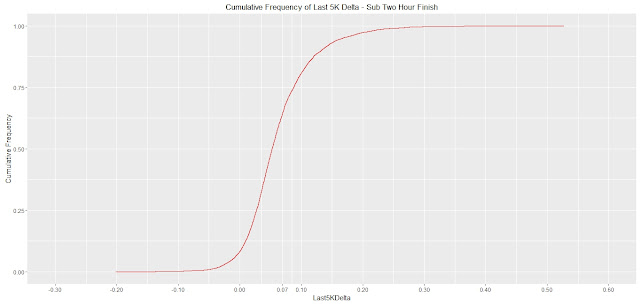
However somewhere behind me was a man carrying a fridge! I decided to look at just those who completed the run in under 2 hours by doing:
> rhmSubTwo <- rhm1[rhm1$ChipTimeSecs<7200,]
Which gives this chart:
Darn it. About 68% of this cohort faded less than me. Not looking so good now...
What about those equal or better than me?
> rhmSubMe <- rhm1[rhm1$ChipTimeSecs<5694,]
Looking pretty poor now :-(. I must pace myself better next time.
Here's all the Python code to create the .csv file:
InputFile = "/home/pi/Documents/RHM/VitalityReadingHalfMarathon_v2.txt"
OutputFile = "/home/pi/Documents/RHM/RHM.csv"
#Open the file
InFile = open(InputFile,'r')
OutFile = open(OutputFile,'w')
#This takes a time in h:m:s or similar and turns to seconds.
def TimeStringToSecs(InputString):
#There are 2 cases
#1)A proper time string hh:mm:ss
#2)Something else with letters and numbers munged together
if len(InputString) == 8:
#Compute the time in seconds
SecondsCount = (float(InputString[0:2]) * 3600) + (float(InputString[3:5]) * 60) + float(InputString[6:8])
return str(SecondsCount)
else:
print "Got this weird string: " + InputString
return "-1"
for i in range(1,10981):
#Initialise variables
Outstring = ""
EndString = ""
MidString = ""
GenderFound = False
#Read a line
InString = InFile.readline().rstrip()
print InString
#Split the line based upon a space
SplitStr1 = InString.split(" ")
#We can rely on the first field which is gun position and second field which is race number. But don't put Gun position as R ignores it!
OutString = SplitStr1[1] + ","
#We can also rely on the last 7 fields of the line which respectively are GunTime,ChipPos,ChipTime,5KSplit,10KSplit,15KSplit,20KSplit
NumFields = len(SplitStr1)
#Compute the end of the output string
for z in range(7,0,-1):
#print "z=" + str(z) + ". Equates to" + SplitStr1[NumFields - z]
EndString = EndString + SplitStr1[NumFields - z] + ","
#Look up the time in seconds. Not for case 6 which is the gun position
if (z != 6):
EndString = EndString + TimeStringToSecs(SplitStr1[NumFields - z]) + ","
#Hardest bit last. Name, Gender, Age and Club. Gender is reliably there, except for long names where it gets mangled.
#Hence find it and you know everything before is the name
for a in range(0,len(SplitStr1)):
if (SplitStr1[a] == "M") or (SplitStr1[a] == "F"):
#THis is the position of the gender which is the "anchor" for everything else
GenderPos = a
#Add it to the middle part of the string. No worries it's in different order to file.
MidString = SplitStr1[a] + ","
#Say we found the gender.
GenderFound = True
#Process for the case where gender was found
if GenderFound:
#Now we know everything before (exclusing first two numbers was the name. Add the parts of the name together. The below code should handle
#complex names
for b in range(2,GenderPos):
MidString = MidString + SplitStr1[b]
#See if it's not the last part of the name. If not add a space
if (b < (GenderPos - 1)):
MidString = MidString + " "
else:
MidString = MidString + ","
#Now test the part after the gender position. If it's "U23" or a number(but not 100 as cllubs start with this!) then this is the age category
if (SplitStr1[GenderPos + 1] == "U23"):
MidString = MidString + SplitStr1[GenderPos + 1] + ","
#Log where the club might start
ClubStartPos = GenderPos + 2
elif SplitStr1[GenderPos + 1].isdigit():
if SplitStr1[GenderPos + 1] != "100":
MidString = MidString + SplitStr1[GenderPos + 1] + ","
#Log where the club might start
ClubStartPos = GenderPos + 2
else:
MidString = MidString + ","
#Log where the club might start
ClubStartPos = GenderPos + 1
else:
MidString = MidString + ","
#Log where the club might start
ClubStartPos = GenderPos + 1
#So now everything from ClubStartPos "might" be a club. We can test this by seeing if what might be the club is actually gun
#time which is 7th from the end
if (SplitStr1[ClubStartPos] == SplitStr1[NumFields - 7]):
MidString = MidString + ","
else:
#Loop adding elements of the club
for c in range(ClubStartPos,NumFields - 7):
MidString = MidString + SplitStr1[c]
#See whether to add a space
if (c < (NumFields - 8)):
MidString = MidString + " "
else:
MidString = MidString + ","
else: #Where there is no gender. Add commas to represent Name,Age and Club and somethign to say it was a long name!!!
MidString = ",Long Name,,,"
#print OutString
#print MidString
#print EndString
print OutString + MidString + EndString
OutFile.write(OutString + MidString + EndString + '\r\n')
InFile.close()
OutFile.close()


No comments:
Post a Comment